Archive for July, 2013

VIDEO: Bicycle Rush Hour Utrecht (Netherlands) III, markenlei

While the state government has put public transport front and centre, with new projects like the North West Rail Link and South East Light Rail Line, its support for bicycles remains less enthused. Even in the 2011 election campaign, then Opposition Leader Barry O’Farrell joked that if Sydney Lord Mayor had been in charge of building the Harbour Bridge then the bike paths would have probably met up, ridiculing what he saw as Ms Moore’s overly keen stance on bike infrastructure.

The current separated bike path network in the CBD is made up of 3 North/South paths which do not currently connect up, as well as one East/West path which links up to only one of the other paths. Click to enlarge. (Source: Open Street Map)

The current separated bike path network in the CBD is made up of 3 North/South paths which do not currently connect up, as well as one East/West path which links up to only one of the other paths. Click to enlarge. (Source: Open Street Map)

Mr O’Farrell, now the Premier, is backed up by Roads Minister Duncan Gay. Mr Gay has complained about the College St bike path, despite the fact that the RTA (now RMS) is of the view that College St was a preferred location for a bike path and that no traffic lanes were removed in order to create it (Source: Sydney Morning Herald, 20 August 2012). Mr Gay has also squashed any hope that a potential future bike hire scheme in Sydney could be exempted from the compulsory helmet laws, making it far less likely that such a scheme would succeed.

But it’s not just the Roads Minister that has put up obstacles to improving bike access. The Transport Minister Gladys Berejiklian dropped the Greenway, a shared pedestrian and bike path in the Inner West, that was to go alongside the light rail extension to Dulwich Hill. Cost savings no doubt contributed to this decision, but the government’s budget shines a light on its priorities. Indeed, when the minister in the state cabinet who has been a strong advocate of public transport shows little interest in progressing such a project, it shows that this mode of transport has few friends in Macquarie St.

Current and proposed bike paths for City of Sydney. Click to enlarge. (Source: City of Sydney)

Current and proposed bike paths for City of Sydney. Click to enlarge. (Source: City of Sydney)

So when news emerged recently that the government was considering a new bike path along a pedestrianised George St, it’s difficult to give this the benefit of doubt. The Central Sydney Traffic and Transport Committee, created by the state government after the 2011 election and required to approve any new bike paths in the CBD, has stalled any new bike paths in the CBD since that date. This has meant that the existing paths have not been able to be linked up, improving connectivity for bike riders going from one part of the CBD to another.

Doing this with a new bike path along George St would achieve this. But in light of past experience, this may well just be another stalling tactic by a government that is just not interested in promoting cycling.

100,000 hits later

Posted: July 24, 2013 in Personal
Tags:

Transport Sydney racked up its 100,000th hit late last night (ironically while I was watching the transport episode of Shitsville Express on ABC2). A big thank you to all those who have visited, liked, shared, and commented on this blog during the last almost 2 years. That includes those who did so by voicing dissenting views to those aired here – we may not always agree on the specifics, but its great to see people passionate and interested about the important issue of transport infrastructure!

I must admit that it is humbling to see that something which started out as a way for me to express some views of interest for my own purposes has grown into something which is read so widely.

100k hits

I’d also like to apologise for the lack of content recently. I began a new job last week and this has eaten up much of my spare time. I will try to continue to do about one post per week, though posts on recently occurring events/news may be somewhat delayed until I have time to gather my thoughts and turn them into something in writing.

In other news, today is also my 30th birthday. Wishes of a happy birthday in the comments section (purely for my own ego) are welcome!

2013-07-15 STA bus time lapse

Visualisation of STA buses in Sydney at 9:01AM on a typical weekday. The bright vertical line in the middle is the Harbour Bridge. (Source: Flink Labs)

Some interesting time lapse visualisations of commuter transport from around the world. All of these show vehicle movements (trains, buses, etc), as opposed to passengers movements, unless otherwise stated.

Sydney

This first video is STA buses only. That means the government Sydney Buses, as well as the Parramatta-Liverpool T-Way buses. Despite the limitations of its data, and that it is now a few years old, it’s also quite clear and easy to watch.

Major corridors like Anzac Parade, Oxford Street, Parramatta Road, Victoria Road, and Military Road stand out quite well. They are the brightest during the day, and the only ones still operating late into the night. By showing busier corridors as brighter, you really get a good idea of what frequent services look like, as opposed to a bus map where all lines look the same.

This is another video of Sydney. It is more recent, includes all modes of public transport, and goes out as far as Newcastle and Wollongong. Trains are shown in the same colour as the line they operate on. It’s also a bit crowded, and harder to follow than the previous video, so it’s recommended that you watch it directly on Youtube with the settings set to 720p(HD) for better quality if it doesn’t do so automatically here.

Melbourne

A similar video to the earlier Sydney bus video, but this time from Melbourne for trains. Blue is for city bound, while yellow are outbound.

Auckland

This video was created by Chris McDowall, but the blog post associated with it no longer appears to be working. So instead, here is a short piece about it from Human Transit, in which the vehicles are described as “tadpoles”.

London

This video is from an article over at the Atlantic Cities, which is worth a read for some background. This shows passenger movements via the collection of Oyster smartcard data. Inbetween the morning and evening commute, passangers are shown as a red dot while at work.

New York City

This video of New York City includes the subway and bus system, as well as some longer distance commuter rail trains (these are most noticeable in Long Island on the right hand side of the map which is otherwise mostly blank). New York has one of the few transport systems in the Western world that runs 24/7 at decent frequencies, with most subway lines running at 20 minute frequencies all night. You can see this in the video, as unlike other cities here where transport is almost non-existant between 2AM to 5AM, because at no point do the dots stop moving around. New York really is the city that never sleeps!

As with before, best seen on Youtube with 720p(HD) settings.

Washington DC

The Washington Metro trains are shown as the colour of their line, while buses are the white dots. Long distance commuter trains (mostly to the North of Washington) are large dots with a while tail. Once again, if it doesn’t show up well here, then try it on Youtube with the maximum 720p(HD) settings.

More videos

If you’re interested in seeing more, the second Sydney video, as well as the New York and Washington videos are from a group called STL Transit, and their Youtube page is full of many other videos. And for a more detailed description of their Vancouver video, make sure to check out the Human Transit post on that particular video.

Discussion on the need for and how to achieve an infrastructure boom, particularly in light of a fading mining boom, is continuing.

The need for an infrastructure boom was outlined here on this blog last week, and a few days after in an article on The Conversation, by Peter Sheehan from the University of Victoria. In it, Prof Sheehan explains that the mining boom has three phases: (1) rising resources export prices relative to import prices, (2) an expansion in mining capacity via investment in the resources sector, and (3) an increase in the quantity of resources exported. Each of the three leads to the next, later dropping back due to cause and effect. For example, rising prices of iron ore eventually lead to a greater quantity of iron ore exports, which brings iron ore prices back down again. It is the first two phases which have peaked and beginning to drop back down to normal, while the third is starting to pick up steam.

Prof Sheehan predicts that mining investment, the second of the three phases, has just recently peaked at $100 billion in 2012-13, but could fall to about half that in the next two years. Demand management is therefore needed to maintain investment and employment, thus preventing a recession. Given Australia’s infrastructure deficit, which he estimates at $700 billion; he calls for finding ways to commit to $200 billion in infrastructure projects over the next few years, thus filling the expected $50 billion a year hole left by falling mining investment. With state governments lacking significant revenue generating opportunities, he calls for federal government involvement; if not through direct funding then via guarantees. Other funding options include the sale of existing assets to build new ones, known as “recycling assets”; or through the private sector.

The requirements for private sector involvement in building infrastructure was recently discussed by Garry Weaven, Chairman of the investment company Industry Funds Management (the relevant part begins 3 minutes into the 10 minute interview). Mr Weaven’s main concern is about how much risk the private sector bears in relation to infrastructure projects. Recent financial failures such as the Cross City and Lane Cove Tunnels in Sydney or the CLEM7 and Airport Tunnels in Brisbane have made the private sector wary of new toll road projects. He points out that “[these deals have] been put together by syndicates who are only concerned to extract value out of making the deal happen, not out of the long term value of the project”. However, the value he refers to appears to be value to the private investors, rather than to the community. While such projects were a financial failure from the investor’s perspective, the community obtained brand new pieces of infrastructure in each case, often at no cost to the taxpayer due to funding coming from user access fees.

However, Mr Weaven suggests that there are around $50 billion in Australian super funds and foreign pension funds available over the next 5-10 years which could be used for infrastructure in Australia. This would go a long way towards the $200 billion target that Prof Sheehan called for in The Conversation article above. But much of this can only be accessed if investor concerns about risk are addressed.

When asked what could be done to reduce investor risk, Mr Weavan provided a number of possibilities; such as guarantees, cash, equity, or loans. But his focus was on having governments build a project first in order to prove traffic levels with a given toll level, then selling it to the private sector. This is the model that is being used for the NSW Government’s WestConnex toll road, a project that Mr Weaven also praised for being funded by the sale of Port Botany (an example of the asset recycling mentioned earlier).

Map of the proposed WestConnex alignment showing it connecting to the City West Link. (Source: WestConnex – Sydney’s next motorway priority, Infrastructure NSW, p. 17)

Map of the proposed WestConnex. Click to enlarge. (Source: WestConnex –
Sydney’s next motorway priority, Infrastructure NSW, p. 17)

Such proposals are not magic bullets to every infrastructure project, the devil is in the detail. Indeed, the inability of public transport to operate at a profit means those projects will almost certainly have to be entirely built and owned by the government, though franchising of their operations to the private sector is an option, as currently exists with buses and ferries in Sydney. With this in mind, $50 billion would put a serious dent in the infrastructure Australia needs in coming years.

But it will not pay for all Australia’s infrastructure needs. Nor can state governments pay for the remaining shortfall on their own. The federal government, with its superior revenue raising powers, needs to play a key role in paying for infrastructure. And here it is disappointing to see that Opposition Leader Tony Abbott continue to refuse to fund any urban rail infrastructure projects.

Mr Abbott originally claimed on April 4 that the Commonwealth has “no history of funding urban rail”. This was soon proven to be incorrect, as while the Federal Coalition may have had no history of funding urban rail the Commonwealth Government absolutely did. When asked about it at a press conference in Western Australia last week, Mr Abbott accepted that the current Federal Government had funded urban rail, but that this was the first time a Commonwealth Government had done so. This is also inaccurate, given that Commonwealth funding for urban rail dates back to the early 1990s, when the Building Better Cities program funded such rail projects as the Pyrmont Light Rail or the Y-Link for the Cumberland Line, both in Sydney. Urban planning and public transport were so neglected during the inbetween years of the Howard Government that when the Rudd Government took power in 2007, Infrastructure Minister Anthony Albanese claimed that he had found “not a single urban planner in the entire Commonwealth Public Service – not one”.

The federal Liberal Party's transport policy consists exclusively of road projects, with no committments to public transport. Click to enlarge. (Source: Our Plan Real Solutions For All Australians, Liberal Party, page 32)

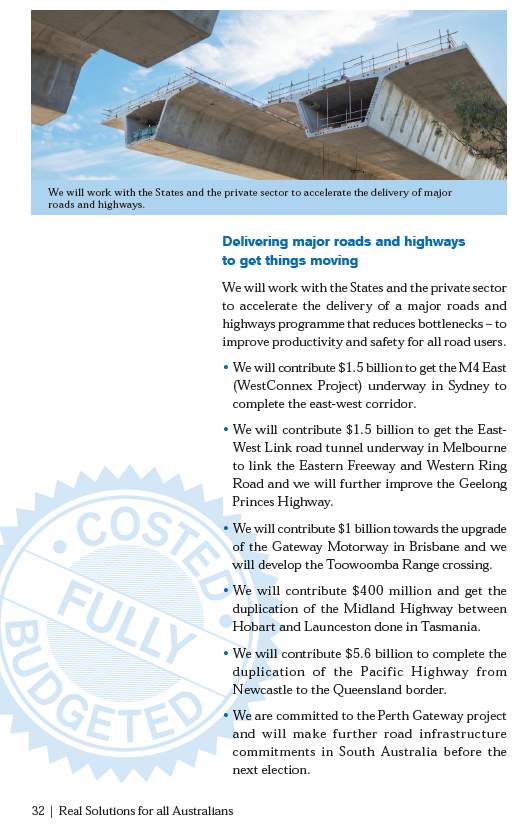
The federal Liberal Party’s transport policy consists exclusively of road projects, with no committments to public transport. Click to enlarge. (Source: Our Plan Real Solutions For All Australians, Liberal Party, p. 32)

Mr Abbott has previously outlined the need for additional infrastructure, and he should be commended for recognising this problem. He also stated his view on Infrastructure Australia’s (IA) role:

“Under the Coalition, Infrastructure Australia would assess all these projects, publish cost benefit analyses for them, and provide a recommended order of priority for Commonwealth funding. If the government varied Infrastructure Australia’s priorities it would need to argue a national interest case for doing so against the yardstick of what makes the most economic sense.”Tony Abbott (April 2011)

However, by failing to argue the national interest in both promising to fund road projects that are not on IA’s priority list and then ruling out the funding of urban rail projects that are on its priority list, Mr Abbott has not lived up to his earlier commitment to lessen Australia’s infrastructure deficit with an apolitical and evidence based approach. This is disappointing, and should be revisited by the Federal Coalition with a view to funding urban rail projects.

Public transport works best in moving large volumes of people to or from a single destination in a short period of time, while private motor vehicles work best in moving people to and from dispersed destinations over a long period of time. Each performs poorly at the other function, which is why public transport has a high mode share for peak hour commutes into dense activity centres and cars have a high mode share for off peak trips that start and end in the outer suburbs.

However, this poses a problem when a major arterial road happens to pass through a major centre, resulting in a high proportion of through traffic. This is the worst of both worlds – lots of cars in a dense centre which have an origin and destination that are not well served by public transport. That is where ring roads come in – they allow these roads to bypass these major centres, while car users still reach their destination. This maintains transport to and within the centre focused on public and active transport (walking and cycling).

The most basic ring road is a bypass. Bondi Junction’s Oxford Street used to be its major thoroughfare, resulting in large amounts of traffic passing through it. The construction of the Sydney Enfield Drive re-routed traffic away from Oxford Street, and even allowed the mall to be pedestrianised and limited to buses in certain parts.

Oxford Street (blue) was once the main street through Bondi Junction. But now it is Sydney Enfield Drive. Click on image for higher resolution. (Source: Open Street Map)

Oxford Street (blue) was once the main street through Bondi Junction. But now it is Sydney Enfield Drive (yellow). Click  to enlarge. (Source: Open Street Map)

A true ring road actually circles around a major centre, such as in Castle Hill. Here the 3 major roads approach Castle Hill and originally converged onto Old Northern Road. A ring road was then set up to circle the Castle Hill Town Centre, with Old Northern Road’s speed limit dropped and more street space designated for pedestrians, on street parking and a bus road. This allowed cafes and restaurants to set up on the street and created a more relaxed environment, compared to the noisy car dominated road that it used to be.

Old Northern Road (blue) used to be the main street through Castle Hill. Now a ring road (yellow) around it has been set up with wide lanes to handle high traffic volumes. Click on image for higher resolution. (Source: Open Street Map)

Old Northern Road (blue) used to be the main street through Castle Hill. Now a ring road (yellow) around it has been set up with wide lanes to handle high traffic volumes. Click to enlarge. (Source: Open Street Map)

In the case of Parramatta, it’s ring road is now considered too small, and the local council has designated an outer ring road. The inner ring road allowed Church Street (Parramatta’s main North-South high street) to be partly pedestrianised and to become a vibrant cafe, restaurant, and shopping precinct. However, the recent growth in the Parramatta CBD means that this ring road is now too small, and thus resulted in an outer ring road made up of the M4 in the South, the Cumberland Highway in the West, and James Ruse Drive in the North and East. This outer ring road is designed with higher speed limits of around 80km/hour, compared to the 60km/hour in the inner ring road, and thus draws traffic away from even the inner ring road.

The local council is seeking to make improvements to the outer ring road in key pinch points, and its proposal has obtained support from Infrastructure NSW.

Church Street (blue) was originally the main road through Parramatta, until a ring road was set up around it (yellow). More recently, a regional ring road has been set up even further out (orange) allowing most traffic to avoid not just the Parramatta CBD but the entire suburb of Parramatta entirely. Click on image for higher resolution. (Source: Open Street Map)

Church Street (blue) was originally the main road through Parramatta, until a ring road was set up around it (yellow). More recently, a regional ring road has been set up even further out (orange) allowing most traffic to avoid not just the Parramatta CBD but the entire suburb of Parramatta entirely. Click to enlarge. (Source: Open Street Map)

A ring road does not even have to go around a centre, and in the case of the Sydney CBD the Cross City Tunnel and Eastern Distributor, which go underneath the city, are also a type of ring road. Together with the Western Distributor, Cahill Expressway, Harbour Bridge, and Harbour Tunnel, these effectively form a ring road, allowing car drivers to go to or from North Sydney, Pyrmont, Kings Cross, or Moore Park without entering a surface street in the CBD.

However, what sets this ring road apart from the other example above is that this is the only case where drivers pay a financial cost for using the ring road, but nothing for going through the CBD. In an ideal world, this situation would be reversed, with access to all parts of these ring roads being free (perhaps with the exception of the Harbour crossings, which cannot be avoided by driving through the CBD) while charging drivers who go through the CBD surface a congestion charge. The new charge could even be used to compensate the private operators of the Cross City Tunnel and Eastern Distributor.

Various freeways, either in tunnels underground or viaducts above ground, effectively form a ring road "around" the CBD. Click on image for higher resolution. (Source: Open Street Map)

Various freeways, either in tunnels underground or viaducts above ground, effectively form a ring road “around” the CBD. Click to enlarge. (Source: Open Street Map)

There is actually one more road even better than a ring road – a public and active transport only road. An example of this is the proposed Wentworth Point Bridge that will link Sydney Olympic Park to Rhodes Business Park, but which will only be accessible to buses, bicycles, and pedestrians. Cars will continue to have to make their way the long way around, which has a similar result to a ring road, as it prevents cars from passing through both Sydney Olympic Park and Rhodes Business Park.

The Australian economy is at a crossroads. The mining boom is starting to fade, and this provides a great opportunity for a new boom in housing construction to take its place. But to do this, governments need to follow up with an infrastructure boom. This is why.

First, the mining boom is not over. Metals prices will remain high for many years to come, and Australia will benefit from exporting its resources. Nor is the mining investment boom, the expansion of the industry through the construction of new mines, over. But mining investment has peaked (see graph below). And it has peaked in 2013, earlier than the 2014 date it was previously expected to peak at.

The mining investment boom is projected to have peaked in early 2013. Click to enlarge. (Source: RBA Chart Pack)

The mining investment boom is projected to have peaked in early 2013. Click to enlarge. (Source: RBA)

The mining investment boom is difficult to understate. Capital expenditure on mining in 2013 is about 10 times what it was a decade ago in 2003, and now comprises more than half of all investment in Australia. Meanwhile, all other investment in 2013 is less than twice its levels in 2003.

Mining investment has increased dramatically, and is 10 times as big as it was a decade a go. Click to enlarge. (Source: RBA)

Mining investment has increased dramatically, and is 10 times as big as it was a decade a go. Click to enlarge. (Source: RBA)

It is this investment boom that has led to such strong economic growth, and which has employed so many Australian workers. Actual mining itself today employs only 2.3% of the Australian workforce (despite mining generating about 10% of national income), and this level of employment is after it more than tripled in the last decade. But many more Australians have been employed during the investment phase: engineers, construction workers, tradies, etc. As a result, both “construction” and “other business services” (which combined now account for almost a quarter of Australia’s workers) have seen the strongest proportional increase in jobs outside of the mining industry.

Employment by industry, using the year 2000 as the base year. Mining has seen a big proportional increase, but off a very low base. Click to enlarge. (Source: RBA)

Employment by industry, using the year 2000 as the base year. Mining has seen a big proportional increase, but off a very low base. Click to enlarge. (Source: RBA)

A post-mining investment boom peak Australian economy therefore has to answer 2 questions. First, where is increased demand going to come from to pick up the slack from falling mining investment? Second, where are all of the workers employed during the mining boom going to work now that the mining investment boom is winding down?

The obvious answer, it would seem, is housing construction. Australia’s supply of housing stock has failed to keep up with demand since the mid 1990s. Up until that point, the rate of growth in number of dwellings was about one percentage point above the rate of growth in the population. (This has been because the number of households grows faster than the size of the total population – families tend to be smaller, meaning more households for a given level of population, while single occupant households continue to grow in popularity.) However, in the mid 90s the spread between these two growth rates disappeared, and during the second half of the 2000s the population was growing at a faster rate than the growth in new dwellings.

Growth in dwellings has traditionally outpaced growth in population. These growth rates began to converge in the mid 1990s. Click to enlarge. (Source: RBA)

Growth in dwellings has traditionally outpaced growth in population. These growth rates began to converge in the mid 1990s. Click to enlarge. (Source: RBA)

The convergence of these two growth rates could be due to average household sizes stabilising. For example, many young people are choosing to stay living with their parents longer, leading to less demand for single occupancy households. This would be demand driven – less demand for more housing, so less is built. But the reality is that housing prices have grown strongly since the mid 1990s, which suggests that it is actually supply driven – insufficient new housing leading to higher prices and thus people choosing to live in larger households to spread the cost of higher housing costs. In other words, the stabilisation in household sizes is a result of insufficient housing supply, rather than the cause of insufficient housing demand.

House prices have increased strongly and consistently since the mid 1990s. Click to enlarge. (Source: RBA)

House prices have increased strongly and consistently since the mid 1990s. Click to enlarge. (Source: RBA)

Housing construction would simultaneously provide the required demand for investment that the mining industry currently provides, while also providing employment to those with the same skills that the mining investment boom currently employs. But for this to work, governments everywhere must provide the necessary infrastructure to cope. That means, among other things, more roads and more rail. And, given the lack of funding available to state governments, this also means the federal government needs to provide assistance in the form of funding. And not just for roads, like Opposition Leader Tony Abbott wants, it needs to be for urban commuter rail too.