Posts Tagged ‘Bicycles’

VIDEO: Ancient river system discovered under Sydney Harbour, 23 September 2015 (Transport for NSW)

This week sees a large number of changes to the Sydney CBD. Though it ended the week with the most significant: the closure of George Street to buses, it began the week with some changes too: the opening and closing of bike paths through the CBD. New bus lanes have been added on Elizabeth Street while another bus lane is soon coming to College Street.

George Street

Construction of the CBD and South East Light Rail will commence on George Street on 23 October, at which point the road will become progressively closed off to all vehicular traffic. It will eventually re-open as a pedestrian only street, with trams on George Street taking passengers from early 2019.

In anticipation of this closure, buses are being removed from George Street as of 4 October. Some will terminate outside of the CBD or on its fringe (including some buses that do not use George Street), while others will be moved to Elizabeth street or are merged with other buses so that they will now through-route in the CBD and come out the other end.

Elizabeth Street

In order to accommodate the additional buses using Elizabeth Street, the bus lanes on it have been moved from kerbside bus lanes to centre bus lanes. This will prevent buses from getting stuck behind other buses waiting at bus stops or getting stuck behind cars waiting to make a left hand turn. These had previously slowed down buses that would otherwise enjoy an exclusive right of way.

Bus lanes on Elizabeth Street have been extended and moved from kerbside bus lanes to centre bus lanes to increase bus capacity on them. Click to enlarge. (Source: Author.)

Bus lanes on Elizabeth Street have been extended and moved from kerbside bus lanes to centre bus lanes to increase bus capacity on them. Click to enlarge. (Source: Author.)

College Street

The College Street bike path is no more. It is to be replaced with a bus lane. This will allow additional Northbound bus capacity now that George Street is no longer available. Additional Southbound bus capacity exists on the Castlereagh Street bus lane, while Elizabeth Street has two way bus lanes.

The bike path on College Street remained open until the Castlereagh Street and Liverpool Street bike paths opened, which now provide North-South access through the CBD. Cyclist groups have protested the removal of the College Street bike path, pointing out that the Castlereagh Street bike path stops at Liverpool Street, which is the same place the College Street bike path starts; also pointing out that the York Street bike path is on opposite side of the CBD to the College Street bike path.

The College Street bike path is now closed and set to be turned into a bus lane. It has been controversially replaced by bike paths on Castlereagh and Liverpool Streets. Click to enlarge. (Source: Author.)

The College Street bike path is now closed and set to be turned into a bus lane. It has been controversially replaced by bike paths on Castlereagh and Liverpool Streets. Click to enlarge. (Source: Author.)

Plans are in place to extend the Castlereagh Street bike path further north; but these plans have been put on hold until 2019, after construction on the light rail has been completed.

Castlereagh Street and Liverpool Street

New bike paths opened on Castlereagh and Liverpool Streets, replacing the College Street bike path. Together with Belmore Park near Central Station and the York Street bike path on the Northern half of the CBD, these now allow bike users to ride from Central Station to the Harbour Bridge entirely segregated from road traffic.

The full CBD bike path network will include an extension of the Castlereagh Street bike path to King Street, which would also see its existing bike path extended from where it currently ends at Clarence Street. However, work on this portion of the bike path network, as well as other extensions such as a bike path North along Pitt Street to Circular Quay or a bike path West along Liverpool Street to Darling Harbour, has been put on hold until 2019 to minimise disruptions  while construction on the light rail on George Street occurs.

Sydney's planned bike path network. Some has been completed, the rest is on hold until 2019 when light rail construction is completed. Click to enlarge. (Source: Transport for NSW, Sydney City Centre Access Strategy, p. 45)

Sydney’s planned bike path network. Some has been completed, the rest is on hold until 2019 when light rail construction is completed. Click to enlarge. (Source: Transport for NSW, Sydney City Centre Access Strategy, p. 45)

There have also been concerns raised about potential plans for loading zones on these bike paths, turning them into what has been called “part time” bike paths. The new bike paths have also drawn criticism for ending one block short of two way traffic on Liverpool Street, requiring East bound bike riders on Liverpool Street to dismount or take alternative routes along Bathurst or Campbell Streets.

Open Drum – The Daily Commute

ABC Open is taking contributions on the topic of “the daily commute”. The deadline for contributions is midday Tuesday 9 June.

“Tell us about your daily commute. What are the joys and challenges? How does it impact your life or your family? Would improved public transport, affordable accommodation near workplaces or better roads help? Whatever happened to telecommuting? Do you have a survival tip or utopian vision for policy makers? Share your story and opinions in 350-700 words.”

1 May: Rail line to Badgerys Creek downplayed

Suggestions for a fast rail service between Badgerys Creek and Sydney CBD in time for the opening of a future Western Sydney Airport were dismissed by the Federal Transport Minister Warren Truss. “A rail line connected to the metropolitan area of Sydney is not essential in that [early] phase” said Mr Truss. The NSW Transport Minister Andrew Constance was more open to the idea, stating that he was “putting all things on the table”, including a possible extension of Sydney Rapid Transit out to Badgerys Creek via the existing Kingsford Smith Airport at Mascot. Proposals exist to extend the recently opened South West Rail Link to Badgerys Creek, but there are no current plans or funding to do so.

The proposed corridors for an extension of the SWRL through to Badgerys Creek and beyond. Click to enlarge. (Source: Transport for NSW.)

The proposed corridors for an extension of the SWRL through to Badgerys Creek and beyond. Click to enlarge. (Source: Transport for NSW.)

4 May: Opal-only ticket gates

New ticket gates that accept only Opal cards are to be trialed at Olympic Park Station. Existing ticket barriers that accept both Opal and paper tickets will continue to be in use.

7 May: Mousetrap to catch graffiti vandals

A new technology is being trialed which detects either spray paint or permanent marker on trains, so far leading to the arrest of 30 individuals. Known as “Mousetrap”, it uses an electronic chemical sensor which detects the vapour of both spray paint and marker pens.  Live CCTV records and provides images directly to Sydney Trains staff. Removing graffiti from the Sydney Trains network cost $34 million last financial year, up from $30 million the year before.

10 May: Epping to Chatswood Line will be disconnected for almost a year

The Epping to Chatswood Line, set to be shut down for 7 months during which it will be converted and connected to the North West Rail Link in order to create the first stage of Sydney Rapid Transit, will be disconnected from the T1 Northern and North Shore Lines prior to its shut down. A recently approved government proposal will see the line operate as a shuttle service between Epping and Chatswood for 4 months prior to this conversion, most likely in 2018.

21 May: Light rail predicted to kill someone each year

A report prepared for the government predicts that 1.14 people will be killed by the new CBD and South East Light Rail line every year on average. Between 2010 and 2014, there have been 3 fatalities involving pedestrians and buses in the Sydney CBD. The report also predicts 1 fatality every 5 years for the existing light rail line to Dulwich Hill, although no deaths have occurred on this line since it opened in 1997.

22 May: Opal card user information handed over to government agencies

57 requests for Opal card data, which include the card user’s address and travel patterns, have been granted by Transport for NSW to government agencies since December 2014. A total of 181 requests were made, with no court approval required in order for information to be handed over. By comparison, information from Queensland’s Go Card had been accessed almost 11,000 times between 2006 and 2014.

26 May: NWRL tunneling 40% complete

Tunnel boring machines on the North West Rail Link have reached Showground Station. 12km of the 30km of tunneling, representing over a third of the total length, is now complete.

26 May: Long Bay Prison sale under consideration

The Government is considering the possibility of selling off Long Bay Prison, possibly raising a estimated $400m. The sale, which would see the site redeveloped, has been linked to a possible extension of the light rail line currently under construction. The CBD and South East Light Rail is set to open in 2019, initially reaching Kingsford. However, an extension as far as La Perouse has been raised as a possibility.

Potential extensions to the CBD and South East Light Rail to Maroubra, Malabar, or La Perouse. Click to enlarge. (Source: Infrastructure NSW, State Infrastructure Strategy Update 2014, p. 40.)

Potential extensions to the CBD and South East Light Rail to Maroubra, Malabar, or La Perouse. Click to enlarge. (Source: Infrastructure NSW, State Infrastructure Strategy Update 2014, p. 40.)

26 May: Congestion will be worse after WestConnex

Internal government reports show that traffic levels on inner city roads around the planned WestConnex tunnels are predicted to be higher in 2026 than in 2011, despite the planned completion of WestConnex by 2023. A spokeswoman for the WestConnex Delivery Authority commented that “[traffic on] the inner south will improve with WestConnex as opposed to a do nothing scenario”.

28 May: Light rail construction schedule announced

VIDEO: Ten Eyewitness News Sydney – Government admits public transport system “broken” (27/5/2015)

A construction schedule for the CBD and South East Light Rail was released to the public. George St is set to see three and a half years of construction, with the new CBD and South East Light Rail set to be built between September 2015 and April 2018. The line is currently scheduled to open in early 2019, following testing of the line.

The Opposition Leader Luke Foley, who recently declared his opposition to light rail on George St, compared the project to the Berlin Wall and declared that it would lead to chaos and confusion.

https://twitter.com/Luke_FoleyNSW/status/603825119916630016

The Government released video (above) of a bus and pedestrian walking down George Street during the evening peak hour showing the pedestrian being faster than the bus. Pedestrianising George St, resulting in the replacement of cars and buses with trams, has been put forward as a way to reduce congestion for public transport users which currently exists in many parts of the city.

https://twitter.com/todisappear/status/604060994101379073

The announcement also included plans to defer construction on the Northern portion of the Castlereagh St bike path until construction on the light rail line is completed. The Roads Minister Duncan Gay had previously proposed including loading zones along portions of Castlereagh St, which would have the effect of making it a “part-time” bike path. Deferring its construction pushes back the need to make a decision on this issue. However, the existing bike path on College St is set to be converted into a bus lane. This will help to handle bus movements once George St becomes closed off to vehicles, but removes a North-South bike path in the CBD for a number of years.

28 May: mX axed

Newscorp is set to discontinue mX, its free commuter newspaper. mX is currently distributed each weekday afternoon in Sydney, Melbourne, and Brisbane; it began in each of these cities in 2001, 2005, and 2007 respectively.

29 May: Electricity privatisation passes lower house

Legislation to allow the 99 year lease of 49% of the NSW electricity distribution network has passed the NSW Legislative Assembly. It now goes to the Legislative Council, where a combination of the Liberal, National, and Christian Democratic Parties that have committed to supporting the legislation have enough votes to ensure its passage through the upper house of Parliament.

https://twitter.com/mikebairdMP/status/604043115293376512

Monday: Massive CBD delays caused by road closures and accidents

Long delays were felt by people travelling into and within the CBD on Monday morning, particularly by bus passengers on the Harbour Bridge, following a number of simultaneous incidents. A number of roads were closed during 27 December to 12 January as part of the CBD and South East Light Rail project. A cable that manages traffic signals was hit by work crews at the corner of Bridge and Grosvenor streets, preventing traffic light phasing from being changed and causing further delays. A breakdown during peak hour in the southbound lane of the Sydney Harbour Tunnel diverted more cross-harbour traffic on to the bridge. In addition there was a crash at 8:15AM approaching the Sydney Harbour Bridge and a motorcycle breakdown that blocked the bus lane at 9:00AM for a short period.

Transport for NSW issued a statement apologising for the delays, later announcing changes to prevent similar delays further into the week. These changes included opening one lane in each direction on Grosvenor and Bridge streets every day between 6am to 10am and 3pm to 8pm, while also rerouting buses on the Harbour Bridge via the Cahill Expressway or Western Distributor,

Wednesday: Bus network changes still not finalised

Changes to the CBD bus network, required due to the imminent closure of George St to allow for construction of the CBD and South East Light Rail, have not yet been finalised according to a report by the Sydney Morning Herald. Construction is to begin shortly after the Centenary of Anzac Day in April of this year. George St is also set to be pedestrianised, meaning that buses will not be able to travel along George St even after construction is completed.

Thursday: Construction to begin on Castlereagh St and Liverpool St bike paths

Work is to begin this month on separated bike paths on Castlereagh St and Liverpool St in the Sydney CBD. Separated bike paths already exist on Kent St and York St, while a third bike path on College St is set to be removed once the Castlereagh St bike path is complete. Previous plans to make the Castlereagh St bike path a “part-time” bike path by allowing loading zones on them at certain times of the day appear to have been dropped following opposition to the proposed plans.

Sydney Strategic Cycle network, much of which is currently being planned or under construction. Click to enlarge. (Source: Transport for NSW, Sydney City Access Strategy, p. 45.)

Sydney Strategic Cycle network, much of which is currently being planned or under construction. Click to enlarge. (Source: Transport for NSW, Sydney City Access Strategy, p. 45.)

Sunday: Salmon for the South West

The South West Rail Link will be represented by the salmon on the rail map. Passenger indicator boards installed at Liverpool Station in preparation for the 8 February opening of the line display the colour salmon, with trains stopping at Glenfield, Edmondson Park, and Leppington. Trains will initially run as a shuttle service between Liverpool and Leppington.

https://twitter.com/kypros1992/status/554070389509197824

Monday: Security the biggest concern for commuters

An NRMA commuter survey found that the most common concerns were cleanliness (50%), clear announcements (47%), air conditioning (46%), overcrowding (43%), safety (38%), parking (37%), and insufficient staff (32%). The survey, ‘Seeing Red on Rail’, had 12,000 respondents and is the second annual survey conducted by the motoring group.

The Shadow Transport Minister Penny Sharpe blamed the concerns on security on government cuts to security staff; arguing that the number of security staff had fallen from 900 staff in 2011 to 551 staff in 2014, a drop of 39%.

When asked what improvements could be made, respondents cited wifi (45%), air conditioning (38%), and mobile apps with real time arrival and departure information (23%). All trains outside of the Olympic Park Line are now air conditioned and real time data has been available on transport apps since April 2013.

Tuesday: Final Waratah train delivered

The last of the 78 Waratah trains has been delivered and has allowed all timetabled train services outside of the Olympic Park Line to be fully air conditioned. During special events air conditioned trains will be provided on the Olympic Park Line, which normally runs as a shuttle service between Lidcombe and Olympic Park.

The government has retained 24 un-air conditioned 8-carriage S-set trains. These are used when a regular air conditioned train is unavailable, and are also likely to be re-introduced for regular timetabled services when the South West Rail Link opens next year as it will require an expansion of train services.

Tuesday: Parramatta light rail receives bipartisan support

The Premier Mike Baird announced $10m for a feasability study into light rail from Parramatta to surrounding areas; including Macquarie Park, Castle Hill, and Bankstown. This follows on from a promise from the opposition for a similar $20m feasibility study if it wins the 2015 state election. Work on the study will begin ‘straight away’ according to Mr Baird, and will build on a pre-feasibility study published by Parramatta City Council.

Map of the proposed Macquarie Park and Castle Hill light rail lines. Click to enlarge. (Source: Western Sydney Light Rail Network - Part 2 Feasibility Report, pp. 4-5)

Map of the proposed Macquarie Park and Castle Hill light rail lines. Click to enlarge. (Source: Parramatta City Council, Western Sydney Light Rail Network – Part 2 Feasibility Report, pp. 4-5)

Tuesday: Centennial Park bike path for Oxford St

The government will spend $1.6m on an 800m bike path along Centennial Parklands, resulting in a new 3.5 metre wide bi-directional cycle path and separate 1.8 metre wide pedestrian path. The new path will help to link Bondi Junction to the CBD along Oxford St in Paddington and is expected to be completed by the end of the year.

Wednesday: Planning approval granted for CBD and South East Light Rail

Planning approval has been granted to the $1.6bn light rail line connecting the CBD to Kingsford and Randwick. Work in the line will commence in 2015 and be completed by 2019 or 2020.

Video: CBD and South East Light Rail Flythrough, Transport for NSW (6 June 2014)

Thursday: Government to consider privatisation to fund infrastructure

State Liberal Party and National Party MPs will on Tuesday consider the potential sale of 49% of the state’s poles and wires assets in a bid to raise capital for major infrastructure projects. The sale will be in the form of a 99 year lease and could raise $15bn, which could then be used to fund a Second Harbour Rail Crossing and other road or rail infrastructure projects. Any “asset recycling”, as this practice has come to be known, will also be eligible for additional Commonwealth funding equal to 15% of any money raised from the sale.

Monday: Monorail re-born as part of NWRL

Parts of Sydney’s monorail, which was taken down late last year, have been used in the construction of the North West Rail Link (NWRL). 60 beams from the monorail have been converted into 29 girders, each 32m long, used to build a bridge at the location of the future NWRL Norwest Station so that cars can continue to travel through the area during the station’s construction.

Tuesday: Budget includes $30bn on land transport, 91% of it on roads

The 2014-15 Federal Budget includes $30bn of spending on land transport over 4 years, of which $26.9bn (91%) is for roads and $2.8bn (9%) is for rail. These form part of a $50bn infrastructure program over the next 6 years, of which $11.6bn is new spending. However, much of this has been achieved by re-allocating funding from rail projects to road projects, with Shadow Transport Minister Anthony Albanese disputing the budget figures in what could be classified as the worst game of pictionary in Australian political history.

Budget forward estimates for road and rail spending. Click to enlarge. (Source: Budget 2014-15.)

Budget forward estimates for road and rail spending. Click to enlarge. (Source: Budget 2014-15.)

The budget included:

  • A return to fuel excise indexation, raising an additional $2.2bn over 4 years.
  • The creation of an asset recycling fund for states that privatise state assets to pay for new infrastructure, worth $5bn over 5 years.
  • The previously committed funding for WestConnex, worth $1.5bn, as well as a $2bn low interest loan to the NSW Government.
  • The previously committed funding for NorthConnex, worth $405m.
  • A roads package to support a future airport at Badgerys Creek, worth $2.9bn over 10 years.

Thursday: 3,500 more public transport services for Vivid

More than 3,500 additional public transport services will be provided during the two and a half week long Vivid Festival. 800,000 visitors came to see Vivid last year, and overwhelmed the transport system. The additional services include 3,200 more bus services, 350 more train services, and 132 more ferry services. Together, these will add capacity for over 660,000 passengers over the period of the festival. As a comparison, Sydney’s rail network has a maximum capacity of around 150,000 passengers during the busiest hour of the morning peak.

This follows criticism of last year’s Vivid Festival, where visitor numbers were underestimated and insufficient public transport services were provided. In particular, no additional train services were provided in 2013, nor were any additional services of any kind provided for the Sunday of the long weekend (which was also the final day of the event).

Saturday: Growing CBD bike path network may not be completed in time

Planned bike paths through the CBD may remain uncompleted until the end of the decade if not finished by next year. The final plan for the CBD bike network was only completed in December 2013, with bike path construction put in limbo in the 2 1/2 years since the 2011 NSW election in order for the network to be planned out. However, the Sydney Morning Herald reports that the NSW Government is hesitant to have 2 major construction projects in the CBD running at the same time, so any bike path construction will be put on hold while light rail is built through George St in Sydney’s CBD in order to minimise traffic disruption. This could begin as early as April 2015, with the line scheduled to open in 2019 or 2020.

Sydney Strategic Cycle network, much of which is currently being planned or under construction. Click to enlarge. (Source: Transport for NSW, Sydney City Access Strategy, p. 45.)

Sydney Strategic Cycle network, much of which is currently being planned or under construction. Click to enlarge. (Source: Transport for NSW, Sydney City Access Strategy, p. 45.)

Once completed, a network of separated bike paths will create a loop around the central CBD, linking up the existing Harbour Bridge to Pyrmont Bridge connection to a number of other streets to the South, East, and West of the CBD.

Monday: SWRL extension to Badgerys Creek in the planning

Planning has begun to preserve a corridor for a new rail line to the proposed new airport at Badgerys Creek. The new corridor will extend from the currently under construction South West Rail Link at Leppington through to Bagderys Creek Airport and then North to St Marys, with another line branching South at Bringelly to Narellan.

The proposed corridors for an extension of the SWRL through to Badgerys Creek and beyond. Click to enlarge. (Source: Transport for NSW.)

The proposed corridors for an extension of the SWRL through to Badgerys Creek and beyond. Click to enlarge. (Source: Transport for NSW.)

The Transport Minister Gladys Berejiklian explained that this was more than just the airport, pointing out that This work isn’t just about servicing an airport, it’s about servicing Western Sydney communities with appropriate transport links, now and into the future”. The new line will pass right through the South West Growth Centre, which is expected to house an additional 300,000 residents in coming decades.

Consultations will run for 6 weeks from 28 April to 6 June on both the alignment and station locations. Currently there are no indicative station locations North of Badgerys Creek, despite one station in this area having been earmarked in a 2013 draft strategy.

Tuesday: NWRL brings 18 storey apartments to Kellyville

Plans for high rise residential buildings up to 18 storeys are being opposed by a local residents group, who want the project restricted to 15 storeys. The project, adjacent to the Kellyville station site that will form part of the North West Rail Link set to open in 2019, was originally proposed to have a maximum height of 25 storeys. Height reductions were achieved by converting the project from a mixed use residential/commercial/retail development into primarily a residential development. The 7,000 to 8,250 square metres of planned office space was removed entirely, the amount of retail space was reduced from 3,000 to 1,900 square metres, and the number of apartment units was cut from 746 to 660 (Source: Hills Shire Council, 29/04/2014 EGM Minutes, pp. 35, 40).

Plans for 18 storey residential apartments next to Kellyville Station on the NWRL. Click to enlarge. (Source: Hills Shire Council, 29/04/2014 EGM Minutes, p. 40.)

Plans for 18 storey residential apartments next to Kellyville Station on the NWRL. Click to enlarge. (Source: Hills Shire Council, 29/04/2014 EGM Minutes, p. 40.)

The Hills Shore Council has also designated areas around the proposed Bella Vista and Showground railways stations for high rise developments in order to house the expected 100,000 new residents expected over the next 25 years.

Wednesday: Ride sharing apps restricted to taxis and hire cars

Private drivers cannot use ride sharing apps like Uber to carry paying passengers according to a clarification by Transport for NSW. These apps can allow individuals to book a driver directly, bypassing the taxi booking companies which currently enjoy close to monopoly status in the market. A Transport for NSW spokesperson said that Under the [Passenger Transport] Act, [ride sharing] must be provided in a licensed taxi or hire car, by an appropriately accredited driver, authorised by Roads and Maritime Services (RMS)”. Any driver authorised by RMS undergoes a police check.

Thursday: Multiple incidents cause transport chaos

Sydney’s road and rail transport network saw significant disruptions after a number of incidents across the city. These included a fatal collision with a cyclist by a bus on Military Road in Neutral Bay, a car crash on the M1 on the Hawkesbury River Bridge, a 2 car crash in the Harbour Tunnel, and a power outage on the light rail line between Dulwich Hill and Lilyfield.

Thursday: School contest to name tunnel boring machines

School students from Sydney’s North West will have the opportunity to name the tunnel boring machines used to create the tunnels for the North West Rail Link. Given the long-held tradition that tunnel boring machines around the world are named after women, the theme will be “Women who have made a positive contribution to life in Sydney”. Competition entries close on May 25, and will only be accepted via the North West Rail Link project website, where there is also more detail about the competition.

Friday: ARTC listed as potential privatisation target

The Australian Rail Track Corporation (ARTC) has been listed for potential privatisation in the long term, with a predicted sale value of $500m. The ARTC is owned by the Commonwealth Government, which in turn owns and operates much of the interstate freight rail network on the East Coast of Australia. It has made a financial loss in all but one year since 2007, however these have all been primarily due to asset impairment write downs and not due to losses from ongoing operations. The ARTC has earned $200m to $300m per year in the last 3 years when measured from an operating cashflow perspective, a measure which strips out non-cash transactions such as asset impairments and depreciation (Sources: ARTC, Annual Report 2013, p. 58 and Annual Report 2011, p. 48).

Friday: Cyclists may require licenses, bike paths lead to more bike usage

Cyclists would be required to hold licences and avoid major roads under a proposal being considered by the Roads Minister Duncan Gay. Meanwhile, documents obtained by the Sydney Morning Herald show that bike paths in the Sydney CBD led to a doubling in the number of cyclists but a reduction in injuries. The documents also show that more bikes use Kent St, King St, and College St each morning peak hour than cars do. These are the 3 streets in the Sydney CBD with separated bike paths currently installed.

Sydney Strategic Cycle network, much of which is currently being planned or under construction. Click to enlarge. (Source: Transport for NSW, Sydney City Access Strategy, p. 45.)

Sydney Strategic Cycle network, much of which is currently being planned or under construction. Click to enlarge. (Source: Transport for NSW, Sydney City Access Strategy, p. 45.)

The government announced its preferred bike path network last year as part of the Sydney City Access Strategy (see image above). It involved removing the College St bike path, but adding new bike paths on Castlereagh St, Pitt St, and Liverpool St while also extending the existing bike paths on Kent St and King St.

Hits

Happy New Year. 2013 has been an eventful one. This blog received almost 138 thousand hits during a year in which:

In the coming year, we can look forward to the opening of the Inner West Light Rail extension to Dulwich Hill and the completion of the Opal rollout (currently scheduled for the end of 2014). Meanwhile, expect the major parties to begin to announce their transport plans ahead of the next state election in early 2015, with things like a Second Harbour rail crossing, a Western Sydney light rail network, Bus Rapid Transit for the Northern Beaches, and potentially plans to privatise the state owned electricity transmission network as a means to pay for all the much needed infrastructure all likely to feature prominently.

But until then, here are some of the major events and stories from the past year, as posted, shared and commented about on this blog —

Posts with the most hits

  1. Draft 2013 timetable (part 1): Introduction 20 May 2013 (7,959 hits)
  2. 2013 timetable re-write (part 3): Untangling the network 22 February 2013 (4,844 hits)
  3. What the 2013 timetable might look like 13 May 2013 (3,908 hits)
  4. Draft 2013 timetable (part 2): AM Peak 22 May 2013 (1,430 hits)
  5. WestConnex plan finalised 19 September 2013 (1,296)

The new timetable drove a lot of traffic to this blog over the previous year, particularly when a draft of the timetable was leaked in May.

Posts with the most comments

  1. 17km Macquarie Park light rail proposed by Parramatta Council 30 August 2013 (50 comments)
  2. How might the NWRL work? 16 October 2013 (49 comments)
  3. Should the North West Rail Link be a metro? 8 February 2013 (47 comments)
  4. How might the CBD and SE Light Rail work? 9 October 2013 (46 comments)
  5. North West Rail Link – policy or politics? 11 June 2013 (43 comments)

The clear thing in common here is the North West Rail Link (NWRL), which tends to generate a lot of discussion back and forth in the comments section. The post on the Macquarie Park light rail was the most commented on post and not actually about the NWRL, but the comments soon shifted towards discussing the NWRL.

Posts with the most activity on social media

  1. All Day Challenge (October 2013), 1 October 2013 (89 shares on Facebook and 3 tweets on Twitter)
  2. Draft 2013 timetable (part 2): AM Peak 22 May 2013 (43 shares on Facebook and 8 tweets on Twitter)
  3. The worst sort of NIMBY 25 September 2013 (27 shares on Facebook and 6 tweets on Twitter)
  4. Opal running 4 months ahead of schedule 28 August 2013 (31 shares on Facebook 2 tweets on Twitter)
  5. Western Sydney makes its case for an airport of its own 15 February 2013 (11 shares on Facebook and 9 tweets on Twitter)

This probably understates the level of sharing over Twitter as tweets are only counted once, regardless of how many times that one tweet may be re-tweeted, whereas Facebook shares are each counted uniquely. That said, the most shared posts have tended to be driven by shares on Facebook rather than tweets on Twitter.

Most searched terms

  1. westconnex (635 searches)
  2. cityrail map (323 searches)
  3. westconnex map (257 searches)
  4. transport sydney (170 searches)
  5. sydney train map (170 searches)

WestConnex was by far the biggest generator of hits from web searches, with the home page being the destination rather than the post itself (preventing those posts about WestConnex from ranking higher) and reflects the fact that the car remains the primary mode of transport for Sydney residents. This is in contrast to activity in the comments section and social media, both of which are more likely to be transport enthusiasts, neither of which had WestConnex in their respective top 5 for the year.

This does perhaps provide a reminder to some advocates of public transport (the writer of this blog included) that there remains some disconnect between them and the regular person on the street when it comes to enthusiasm for public transport and dislike of cars or roads.

A merry Christmas to all the readers. Here’s hoping Santa was kind to you this year. This blog’s author, historically a Westie – though residing in Sydney’s Eastern suburbs these days, received a Western Sydney Wanderer’s jersey.

WSW

Western Sydney also received some good news right before Christmas in the form of support for an airport at Badgery’s Creek from Liverpool Council, which includes the Badgery’s Creek area. It’s clear that the debate over an airport has moved on from whether one should be built, and is now over how best to build one so that Western Sydney receives the maximum benefit.

Today’s post is about engineering solutions for efficient movement of people in the form of 2 videos.

The first is in Spanish with English subtitles from Santiago, Chile (taken from the great transport blog Human Transit). It explains how a gate in the middle of a platform ensures that passengers enter the train carriage at the right spot, rather than trying to jockey for a good position when leaving the carriage onto the platform. While this gate appears irrational from the perspective of the individual, it makes the movement of people more efficient overall, even to the benefit of those who might appear to be worse off as a result.

In Sydney, the marshal’s trialled at Town Hall appear to mimic this sort of idea. While the North West Rail Link could initially see overcrowding at Chatswood as large numbers of passengers transfer from one train to another until such a time as a second Harbour Crossing is completed. Both scenarios could learn something from this low-tech engineering solution.

The second video looks at how intersections in the Netherlands are designed to allow bikes and cars to cross safely. The simplicity of the solution is breathtaking. Even more impressive is the way it allows right hand turns to be executed safely and easily (in the video they are left hand turns, due to the Dutch driving on the opposite side of the road to Australians).

With the accelerated expansion of bike paths in Sydney, this is also somewhere that city planners in Sydney could learn a thing or two from overseas.

VIDEO: Bicycle Rush Hour Utrecht (Netherlands) III, markenlei

While the state government has put public transport front and centre, with new projects like the North West Rail Link and South East Light Rail Line, its support for bicycles remains less enthused. Even in the 2011 election campaign, then Opposition Leader Barry O’Farrell joked that if Sydney Lord Mayor had been in charge of building the Harbour Bridge then the bike paths would have probably met up, ridiculing what he saw as Ms Moore’s overly keen stance on bike infrastructure.

The current separated bike path network in the CBD is made up of 3 North/South paths which do not currently connect up, as well as one East/West path which links up to only one of the other paths. Click to enlarge. (Source: Open Street Map)

The current separated bike path network in the CBD is made up of 3 North/South paths which do not currently connect up, as well as one East/West path which links up to only one of the other paths. Click to enlarge. (Source: Open Street Map)

Mr O’Farrell, now the Premier, is backed up by Roads Minister Duncan Gay. Mr Gay has complained about the College St bike path, despite the fact that the RTA (now RMS) is of the view that College St was a preferred location for a bike path and that no traffic lanes were removed in order to create it (Source: Sydney Morning Herald, 20 August 2012). Mr Gay has also squashed any hope that a potential future bike hire scheme in Sydney could be exempted from the compulsory helmet laws, making it far less likely that such a scheme would succeed.

But it’s not just the Roads Minister that has put up obstacles to improving bike access. The Transport Minister Gladys Berejiklian dropped the Greenway, a shared pedestrian and bike path in the Inner West, that was to go alongside the light rail extension to Dulwich Hill. Cost savings no doubt contributed to this decision, but the government’s budget shines a light on its priorities. Indeed, when the minister in the state cabinet who has been a strong advocate of public transport shows little interest in progressing such a project, it shows that this mode of transport has few friends in Macquarie St.

Current and proposed bike paths for City of Sydney. Click to enlarge. (Source: City of Sydney)

Current and proposed bike paths for City of Sydney. Click to enlarge. (Source: City of Sydney)

So when news emerged recently that the government was considering a new bike path along a pedestrianised George St, it’s difficult to give this the benefit of doubt. The Central Sydney Traffic and Transport Committee, created by the state government after the 2011 election and required to approve any new bike paths in the CBD, has stalled any new bike paths in the CBD since that date. This has meant that the existing paths have not been able to be linked up, improving connectivity for bike riders going from one part of the CBD to another.

Doing this with a new bike path along George St would achieve this. But in light of past experience, this may well just be another stalling tactic by a government that is just not interested in promoting cycling.

Public transport works best in moving large volumes of people to or from a single destination in a short period of time, while private motor vehicles work best in moving people to and from dispersed destinations over a long period of time. Each performs poorly at the other function, which is why public transport has a high mode share for peak hour commutes into dense activity centres and cars have a high mode share for off peak trips that start and end in the outer suburbs.

However, this poses a problem when a major arterial road happens to pass through a major centre, resulting in a high proportion of through traffic. This is the worst of both worlds – lots of cars in a dense centre which have an origin and destination that are not well served by public transport. That is where ring roads come in – they allow these roads to bypass these major centres, while car users still reach their destination. This maintains transport to and within the centre focused on public and active transport (walking and cycling).

The most basic ring road is a bypass. Bondi Junction’s Oxford Street used to be its major thoroughfare, resulting in large amounts of traffic passing through it. The construction of the Sydney Enfield Drive re-routed traffic away from Oxford Street, and even allowed the mall to be pedestrianised and limited to buses in certain parts.

Oxford Street (blue) was once the main street through Bondi Junction. But now it is Sydney Enfield Drive. Click on image for higher resolution. (Source: Open Street Map)

Oxford Street (blue) was once the main street through Bondi Junction. But now it is Sydney Enfield Drive (yellow). Click  to enlarge. (Source: Open Street Map)

A true ring road actually circles around a major centre, such as in Castle Hill. Here the 3 major roads approach Castle Hill and originally converged onto Old Northern Road. A ring road was then set up to circle the Castle Hill Town Centre, with Old Northern Road’s speed limit dropped and more street space designated for pedestrians, on street parking and a bus road. This allowed cafes and restaurants to set up on the street and created a more relaxed environment, compared to the noisy car dominated road that it used to be.

Old Northern Road (blue) used to be the main street through Castle Hill. Now a ring road (yellow) around it has been set up with wide lanes to handle high traffic volumes. Click on image for higher resolution. (Source: Open Street Map)

Old Northern Road (blue) used to be the main street through Castle Hill. Now a ring road (yellow) around it has been set up with wide lanes to handle high traffic volumes. Click to enlarge. (Source: Open Street Map)

In the case of Parramatta, it’s ring road is now considered too small, and the local council has designated an outer ring road. The inner ring road allowed Church Street (Parramatta’s main North-South high street) to be partly pedestrianised and to become a vibrant cafe, restaurant, and shopping precinct. However, the recent growth in the Parramatta CBD means that this ring road is now too small, and thus resulted in an outer ring road made up of the M4 in the South, the Cumberland Highway in the West, and James Ruse Drive in the North and East. This outer ring road is designed with higher speed limits of around 80km/hour, compared to the 60km/hour in the inner ring road, and thus draws traffic away from even the inner ring road.

The local council is seeking to make improvements to the outer ring road in key pinch points, and its proposal has obtained support from Infrastructure NSW.

Church Street (blue) was originally the main road through Parramatta, until a ring road was set up around it (yellow). More recently, a regional ring road has been set up even further out (orange) allowing most traffic to avoid not just the Parramatta CBD but the entire suburb of Parramatta entirely. Click on image for higher resolution. (Source: Open Street Map)

Church Street (blue) was originally the main road through Parramatta, until a ring road was set up around it (yellow). More recently, a regional ring road has been set up even further out (orange) allowing most traffic to avoid not just the Parramatta CBD but the entire suburb of Parramatta entirely. Click to enlarge. (Source: Open Street Map)

A ring road does not even have to go around a centre, and in the case of the Sydney CBD the Cross City Tunnel and Eastern Distributor, which go underneath the city, are also a type of ring road. Together with the Western Distributor, Cahill Expressway, Harbour Bridge, and Harbour Tunnel, these effectively form a ring road, allowing car drivers to go to or from North Sydney, Pyrmont, Kings Cross, or Moore Park without entering a surface street in the CBD.

However, what sets this ring road apart from the other example above is that this is the only case where drivers pay a financial cost for using the ring road, but nothing for going through the CBD. In an ideal world, this situation would be reversed, with access to all parts of these ring roads being free (perhaps with the exception of the Harbour crossings, which cannot be avoided by driving through the CBD) while charging drivers who go through the CBD surface a congestion charge. The new charge could even be used to compensate the private operators of the Cross City Tunnel and Eastern Distributor.

Various freeways, either in tunnels underground or viaducts above ground, effectively form a ring road "around" the CBD. Click on image for higher resolution. (Source: Open Street Map)

Various freeways, either in tunnels underground or viaducts above ground, effectively form a ring road “around” the CBD. Click to enlarge. (Source: Open Street Map)

There is actually one more road even better than a ring road – a public and active transport only road. An example of this is the proposed Wentworth Point Bridge that will link Sydney Olympic Park to Rhodes Business Park, but which will only be accessible to buses, bicycles, and pedestrians. Cars will continue to have to make their way the long way around, which has a similar result to a ring road, as it prevents cars from passing through both Sydney Olympic Park and Rhodes Business Park.

The federal Liberal Party's transport policy consists exclusively of road projects, with no committments to public transport. Click on image for higher resolution. (Source: Our Plan Real Solutions For All Australians, Liberal Party, page 32)

The federal Liberal Party’s transport policy consists exclusively of road projects, with no commitments to public transport. Click on image for higher resolution. (Source: Our Plan Real Solutions For All Australians, Liberal Party, page 32)

Opposition Leader Tony Abbott declared last week that he would be committing no funding to public transport ahead of this year’s election, despite having committed $4bn to road projects in Sydney, Melbourne, and Brisbane.

“We spoke to Infrastructure Australia and their advice was that the most pressing road priority in Melbourne was the east-west link. The Commonwealth government has a long history of funding roads. We have no history of funding urban rail and I think it’s important that we stick to our knitting, and the Commonwealth’s knitting when it comes to funding infrastructure is roads.”Tony Abbott, Federal Opposition Leader (4 April 2013)

His first point, about the highest priority road project in Melbourne, is correct because he is talking about road projects specifically rather than transport projects in general. However, according to Alan Davies at The Urbanist, the East-West Link road is only on Infrastructure Australia’s “Real Potential” stage, the second of four categories, while the Melbourne Metro rail project is in it’s top “Ready to Proceed” category. At best, Mr Abbott is asking the wrong question, at worst he is committing money to a project with a benefit cost-ratio of only 0.50 (i.e. the benefit is less than the cost), when he could be funding the Melbourne Metro with a benefit-cost ratio of 1.30 (figures from Alan Davies’ article linked to previously).

His second point, on the Commonwealth government having no history of funding urban rail, is just flat out wrong. As Daniel Bowen points out when listing just some of the urban rail projects funded by the Commonwealth, “perhaps the Federal Coalition has no history of funding urban rail, but the Commonwealth most certainly does”.

“I think all but the most car-centric person would see that in modern growing cities, you can’t move everybody around by road — that rail, particularly in inner-city areas, is much more efficient. Unfortunately unlike some of his Liberal colleagues (and unlike conservatives in such places as the UK), Tony Abbott does appear to be the most car-centric person. It comes down to this: if you want more people on public transport, provide more public transport. If you want more people on the roads, build more roads. Abbott is clearly backing the latter.”Daniel Bowen (5 April 2013)

The decision to fund road projects over rail is not a merit based decision, it is a politically based on (and one which I have criticised the Labor Party for doing in the past on both WestConnex and the Parramatta to Epping Rail Link). As a comparison, urban rail has received a majority of Infrastructure Australia funding when merit is used as the criteria.

“Fifty-five per cent of Infrastructure Australia nation-building money went to urban rail on merit.” –  Professor Peter Newman, Infrastructure Australia advisory board member (4 April 2013)

The state governments in Victoria, Queensland, and Western Australia, all governed by Mr Abbott’s Liberal-National Coalition, have also all publically voiced their opposition to his decision.

“We will continue to vigorously pursue federal government funding for this important infrastructure development.” – Denis Napthine, Victorian Premier (4 April 2013)

“Given the current Federal (Labor) Government’s support of $236 million for rail infrastructure at the Perth City Link and $3 million towards planning of the MAX light rail project, we expect that future Federal governments, whether Liberal or Labor, would consider the benefits of funding such important transport initiatives based on merit.”Colin Barnett, WA Premier (4 April 2013)

“The reality is if there is not federal funding for these projects, they cannot proceed, we cannot afford to do them alone. We’ll continue that process of lobbying the federal coalition and federal Labor.”Scott Emerson, Queensland Transport Minister (4 April 2013)

Feeling the heat, Mr Abbott later clarified his statement, pointing out that his government would still fund freight rail and interstate transport, and that it was only commuter urban rail projects that he was referring to. On his side is the division of powers set out in the Australian constitution, where the Commonwealth government is responsible for freight and interstate transport, leaving state governments responsible for urban transport. While Mr Abbott is well within his rights to follow a strict interpretation of the role of the Commonwealth government, it is also true that such a view would preclude federal funding of schools and hospitals, given that they are a state responsibility. This is why the days of health, education, and transport being funded solely by the states has now long gone.

This is where his argument starts to fall apart on constitutional grounds, and it becomes clear that it is ideologically driven. He seems much like American conservatives, who see public transport as a socialist means of transport “for the masses” requiring government subsidy while seeing the private motor vehicle as a form of transport that is liberating and free and more in line with their small government philosophy. He looks at the inner city areas which most heavily use public transport and sees Labor and Greens leaning voters, then at the car dominated outer suburban areas are where the swinging voters he needs live and decides that the politically astute thing is to build more roads.

“Public transport is generally slow, expensive, not especially reliable and still [a] hideous drain on the public purse…Mostly though…there just aren’t enough people wanting to go from a particular place to a particular destination at a particular time to justify any vehicle larger than a car, and cars need roads”Tony Abbott, Battleline, page 174 (2009)

Not all conservatives still think this way. NSW Transport Minister Gladys Berejiklian has successfully championed public transport despite opposition from Infrastructure NSW Chairman Nick Greiner and CEO Paul Broad, while London Mayor Boris Johnson is pushing an ambitious £913m expansion of his city’s bike network. They understand that you can’t build your way out of congestion with more roads and that, while roads play an important role, so does public and active transport. It’s disappointing to see that Mr Abbott hasn’t worked this out yet.

The ABS has released the journey to work data from the 2011 Census (it calls it “travel to work”), and it shows that public and active transport have increased their share of total trips since the previous census in 2006.

There were 1,644,247 daily trips to work in Greater Sydney made in 2006, which increased by 9.7% to 1,803,298 in 2011. This means that if a transport mode holds on to its share of trips, then the absolute number of trips has risen.

The private car remain the most common mode of trip, with 62.6% of trips made by car drivers and 5.2% made by car passengers, down from 63.5% and 6.1% respectively in 2006 (trips made by truck drivers have been counted as car drivers). However, measured in absolute terms, the total number of trips made by car has risen from 1,144,950 to 1,222,479, and increase of 77,529 or 6.8%.

Public transport (including trips where a car is used for a portion of the journey – these trips were not counted in the car trips figure above) have seen an increase in their share of trips, from 20.7% in 2006 to 22.8% in 2011. This is an increase of 20.5% or 70,089 in absolute terms, which is quite similar to the increase in car trips of 77,529. Virtually all the increase in trips from 2006 to 2011 is attributed to either car or public transport trips, and they share this increase almost 50/50. This is in contrast to Infrastructure NSW, which has argued that cars will continue to do the heavy moving when it comes to transport and that roads should therefore receive priority funding over public transport – an argument which requires you to close one eye, tilt your head and stand on one foot to be convincing.

The next biggest share is in active transport. In 2006, 4.8% of trips were on foot, which has fallen slightly to 4.7% in 2011. The largest increase has been for bicycles, rising by 44% albeit from a low base of 0.7% in 2006 to 0.9% in 2011.

Sydney remains the major Australian city with the highest proportion of public transport trips to work, but also the lowest proportion of bicycle trips to work.

Finally there is the other (including taxis and motorbikes) and not stated categories, which taken together were 4.2% in 2006 and 3.9% in 2011.

Of interest are the gender differences in mode usage. Some modes of transport see a significant difference in use when looking at its share of use by men or by women. Car drivers tend to be men (65.6%) more than women (58.8%), while car passengers tend to be women (6.9%) rather than men (3.8%). When it comes to public transport, it is used more by women (25.5%) than by men (20.6%), particularly for buses. The biggest disparity between the genders is for bicycles, with men (1.3%) being more likely to ride a bike than women (0.4%).

The journey to work data is measured based on trips, and does not take distance into account. (Passenger km are provided separately by the NSW Bureau for Transport Statistics as part of the Household Travel Survey.) Given that the vehicle km per capita for cars has been dropping in recent years, it would not be surprising to see that, when trip distance is taken into account, car’s share of travel is actually declining even faster than the figures above indicate.

Three things came up in the news in the previous week which are worth touching on just quickly – a new Cityrail timetable, the report by Canberra Airport recommending the construction of high speed rail between Sydney and Canberra rather than building a second airport in the Sydney basin, and the NSW Budget Estimates hearings.

New Timetable

A few extra train services are being added to the timetable. (The associated Transport for NSW press release says it is 44 services per week, while the Telegraph reports 36 new services per week, but I count only 34.) It includes 4 new services each day (weekdays only) to the Illawarra/Eastern Suburbs Line as well as 2 new services each day (weekdays and weekends) to the Blue Mountains Line (all the way to Bathurst, which until recently was served by buses rather than trains). This is on top of the 63 new services per week introduced last year, bringing it up to about an extra 100 train services per week since the Coalition won the 2011 election.

However, word is that it is the next timetable change, coming at the end of 2013, that will deliver real changes to service levels on the Cityrail network and will also involve a complete re-write of the timetable from the ground up. This is when the Liverpool turnback platform and Kingsgrove to Revesby track quadruplication are set to be completed, allowing for a significant increase in the number of trains operated. This is particularly the case for trains that use the City Circle, which currently is not being used to its full capacity during either the morning or afternoon peak.

Canberra High Speed Rail

A report released by Canberra Airport suggests that High Speed Rail (HSR) could enable Canberra Airport to function as Sydney’s second airport, eliminating the need to build a second airport in the Sydney Basin. Given the $11bn price tag of HSR, compared to $9bn for a second airport, and a total travel time of 57 minutes into the Sydney CBD, the plan appears to be quite reasonable. However, Alan Davies points out that the $11bn figure comes from the federal government’s HSR feasibility study, which found that:

“the report says there’s only a 10% chance that estimate wouldn’t be exceeded. No one uses that figure – the preferred estimate is $19 billion because at least there’s a 90% chance it won’t be exceeded” – Alan Davies (10 Oct, 2012), The Urbanist

A HSR link was also quickly rejected by the Prime Minister, Julia Gillard, who said it was “some time away” from being viable.

Hopefully one or both the state and federal government will bite the bullet and accept the conclusion of the both the Joint Study on Aviation Capacity and the Infrastructure NSW report, which recommend a second airport be built at Badgerys Creek. This location provides improved transport links and employment opportunities for the growing Western Sydney region. It’s an unpopular decision, but it’s the right one.

Budget Estimates

The Transport Minister, Gladys Berejiklian, fronted the state budget estimates hearing on transport on Tuesday. Major information arising from that hearing included points below.

Heavy rail:

The portion of the hearings that made the headline news was about non-air conditioned trains being kept on, despite these being scheduled to be phased out by the end of 2014 once all the Waratah trains are delivered. It comes from the following question and answer:

“Are you planning beyond 2014 for the C and K sets and other non air-conditioned sets to have to remain on the network to meet the timetable changes…Mr Wielinga are you confident that the C, K and S sets are not going to remain on the network beyond the rollout of the Waratahs?” – Penny Sharpe (9 Oct, 2012), Shadow Transport Minister

“No. We are being as flexible as we can be. The question that needs to be asked is: How many additional services do we want to put on? If our customers are seeking additional services and we want to increase that above what is programmed at the moment, we will use whatever rolling stock is available to us to provide those customer services.” – Les Wielinga (9 Oct, 2012), Director General of Transport for NSW

Some confusion remains as to what this means, primarily due to Ms Sharpe’s questions, and whether she was asking only about non-air conditioned trains, or about the old silver sets (each given a letter classification, with C and K being air conditioned, while L, R, and S are not air conditioned). This led to the following back and forth on Twitter:

https://twitter.com/big_bertha1/status/255532668832329728 https://twitter.com/big_bertha1/status/255533907733250048

What could potentially be happening is that all non-air conditioned trains are being withdrawn from service, but kept warehoused for use in case of emergency, should a situation arise in which Cityrail was short on trains. In these cases, a non-air conditioned train is better than a cancelled train. Mr Wielinga’s response would be consistent with such a scenario. Or alternatively, it could just mean that increased numbers of services each day means that some non-air conditioned trains will be kept on in regular service in order to meet timetabling requirements.

Ms Berejiklian was asked if a second harbour crossing that is not in the form of an under-harbour tunnel was being considered, but she did not directly address the question (page 30). She instead pointed out that 15 different options had been considered for Sydney’s rail network once the Northwest Rail Link (NWRL) is completed, but these were high level options (such as converting the existing harbour crossing to single deck metro, rather than building a new one, or maintaining double deck rolling stock on the entire network) that did not include specific alignments. She did, however, reaffirm that a second harbour crossing will be built (page 14).

A figure cited by the Sydney Morning Herald of $4bn of extra work which would be required to handle the NWRL once it is completed is not new money, and these costs are already budgeted for.

The narrower tunnels on the NWRL, large enough for single deck rolling stock but not double deck rolling stock, will result in cost savings. However, the cost savings are less than the cost of refitting the existing Epping to Chatswood section of the line to run the single deck trains (page 29). The real savings would occur when building new tunnels, most potentially an under-harbour tunnel, as single deck trains can handle steeper gradients than the heavier double deck trains.

Light rail:

The Greenway – a pedestrian and bicycle path, which was originally part of the Dulwich Hill light rail extension before being deferred, would have costed $37m to build (page 34), compared to the cost of the light rail extension of $176m. The $176m figure includes $24m for rolling stock (page 16), and was revised upwards from $120m under the previous Labor Government, which (along with the delay in its completion) Ms Berejiklian says is because the previous government had not done any geotechnical work, considered where the rolling stock would be acquired from, etc.

A final decision on George St light rail will be made in the final transport plan (page 33), to be released by the end of the year.

Miscellaneous:

Opal is on track to be rolled out on ferries in December of this year.

The Director General of Transport for NSW, Les Wielinga, was never a full director of Infrastructure NSW, he was only ever a temporary “guest” (page 9). Mr Wielinga also argued that the differing conclusions made by his organisation (Transport for NSW) and Infrastructure NSW was due to each taking a different approach, and so different solutions were inevitable but that he also did “not think this is a problem”.

Warning: This post contains lots of statistics and graphs. If this is the sort of thing you are into, then may I recommend the blog Charting Transport.

The NSW Bureau of Transport Statistics does 30 year forecasts of transport within the Sydney Metropolitan area every 5 years. The most recent are for 2006-36, based on the 2006 census results (the transport results of the 2011 census have not yet been released), and give an insight into how we are likely to get around. I’ll be looking more specifically at the Sydney statistical division figures, which exclude Newcastle but include the Illawarra.

This post looks only at all day transport, not peak hour. Ferries do not appear to be included.

The assumptions on which it is based have already changed slightly, with a Second Harbour Crossing now expected to be built instead of the Parramatta to Epping Rail Link, so these figures probably underestimate rail’s proportion of trips to be undertaken. But otherwise the assumptions seem fairly sound.

Number of trips

In 2006 there were 16,175,000 trips on an average weekday. Just over 8 million of these were trips made by the driver of a car (50.1% of all trips). Most other trips were either car passengers (20.7%) or made on foot (19.1%), each accounting for just over 3 million trips. The remaining 1.6 million trips were split fairly evenly between rail (4.5%) and bus (4.1%). Taxis, bikes and light rail made up a tiny 203,000 trips (1.2%).

All are expected to grow over the subsequent 30 years, and by 2036 there are projected to be 22,160,000 trips per day, an increase of 6 million or 37% on 2006. The proportions are expected to remain roughly the same as in 2006, so the increases are also roughly in line with their share of trips in 2006. Looking just at the increase in trips, there will be an additional 3.3 million by car drivers (56.4% of the increase in trips), 1.0 million by car passengers (16.8%), 0.9 million walking (15.6%), 349,000 on trains (5.9%), 234,000 on buses (4.0%) and 79,000 on taxis/bike/light rail (1.4%). The disproportionate increases are in car drivers, rail and light rail.

Note: The first 3 modes of transport (car driver, car passenger and walking) are so dominant, accounting for 90% of all trips, that a second graph is included below showing just the other modes of transport so that they can more easily be read.

As mentioned previously, when looking at proportional increases, car driver, rail and light rail modes are projected to see the biggest increases. Light rail sees such a large proportionate increase (521%) that it’s included in a separate graph. This is due to the relatively small size of the current light rail network, which here is assumed to grow to include the Dulwich Hill (by 2016) and CBD (by 2021) extensions. It does not appear to factor in its inclusion in the myZone system, nor possible extensions to the Universities of Sydney and NSW. So it is quite possible that growth could be even higher. However, it should be stressed again that this increase is from a very low base.

Other modes of transport are expected to mostly see a steady increase in number of trips, with the exception of rail and bus. Rail growth picks up steam over time, with the strongest growth occurring in the 2020s once the Northwest Rail Link (NWRL) and Parramatta to Epping Rail Link (PERL) are completed. Although the PERL looks unlikely to be built to that timetable, the additional capacity from a Second Harbour Crossing is likely to have a similar if not larger effect on rail patronage during that period. Ultimately, rail trips are projected to grow by 48%.

This, together with expansions to the light rail network in the late 2010s means that growth of trips by bus grows rapidly at first while light rail and heavy rail infrastructure is being constructed, then slows once it comes online, growing by 35% over the 30 year period. This will be most obvious on the M2, where the government is expected to remove many bus services once the NWRL is completed, and the CBD, where bus lines are likely to be rerouted to become feeders for light rail rather than travel through the CBD itself.

The other large increase is car driver trips, which grow by41%. All other modes are projected to increase by between 28% and 37%.

Distance of trips

Just looking at the number of trips can be misleading. For example, although rail and bus have a fairly even share of trips, rail trips tend to be much longer than bus trips. Similarly, walking tends to be for fairly short trips.

In 2006, the longest average trip was a rail trip of 24.4km, expected to rise 14% to 27.6km in 2036.

The average length trip on cars, buses and taxis tend to be in the middle of the pack. Car drivers travelled 9.7km and car passengers travelled 7.6km in 2006, with both projected to drop 7% to 9.0km and 7.0km by 2036. Trips on buses, 8.5km in 2006, are projected to increase by 7% to 9.1km by 2036. Meanwhile, taxi trips averaged 6.3km in 2006 and are projected to fall slightly to 6.0km by 2036.

Short trips tended to be on foot (0.9km) or bicycle (3.1km), and their average distance is not expected to change much between 2006 and 2036.

Note on light rail: The data says that the average trip for light rail was 18.2km in 2006, rising to 22.6km in 2036, which seems unusual given that the current line is only 7km long, and even when the extension is completed will still be only roughly twice that distance. It might have something to do with the statistical methodology, which looks at distance by “main mode”. 

Putting the average trip distance together with the number of trips gives us the total number of passenger kilometres travelled on the average workday.

In 2006, residents of Sydney travelled a total of 131 million km on an average workday. Here again we see cars travel dominating travel, car drivers travelled 78 million km (59.5% of all passenger km) while car passengers travelled 25 million km (19.3%). Next biggest is rail, with just under 18 million km (13.6%), then bus travel with 5.6 million km (4.3%), and walking with 2.7 million km (2.1%). The remaining 1.0 million km (0.7%) were shared by light rail/taxis/bikes.

By 2036 it is projected that Sydney residents will travel 177 million km, an increase of 46 million km or 35% on 2006. This increase is driven mostly by car drivers, with an additional 24 million km (53.0% of the increase), followed by rail with 12 million km (26.9%), car passengers with 5.2 million km (11.3%), and buses with 2.5 million trips (5.5%). The remaining 1.5 million km (3.3%) were shared by light rail/taxis/bikes/walking.

Note: Similarly to before, as the car driver category is so dominant, accounting for 60% of all trips, a second graph is included below showing just the other modes of transport so that they can more easily be read.

When measuring the proportional increase in total passenger km, it is the public transport modes that have the biggest increases: light rail, rail and buses. As was the case previously, light rail’s increase is off such a low base that it is on a completely different scale to the increase in all other modes of transport, and so is included in a separate graph. Light rail km are projected to increase 670% between 2006 and 2036.

The dramatic increase in rail usage is clearly seen here. Other than light rail, it is projected to see the biggest proportionate increase in both number of trips (by 48%) and average distance of each trip (by 14%), resulting in a huge 69% increase in total passenger km. Total bus passenger km also see a modest increase, rising 45% between 2006 and 2036.

Other modes of transport are projected to see an increase in passenger km of between 20% and 31%.

Conclusion

If the end goal is to increase public transport (buses, trains, light rail) and active transport (walking, bicycles), then these projections show how much of a challenge that is. The proportion of trips on public and active transport are projected to fall from 28.3% to 27.8%, though this appears to be due to an increase in short distance car trips. However, even when looking at total passenger km, that proportion still only increases from 20.2% to 24.1%.

Meanwhile, total car km are projected to increase by 31%, meaning that an additional 31% of roadspace will be needed to keep up. Alternatively, existing roadspace could be used more efficiently via decentralisation and/or congestion tolling to encourage a more even distribution of traffic, both over time and over space.

Ideally an increase in public transport and active transport use would allow a static car km statistic, meaning less stress on our road system. And lets not forget that this is all a bit of a chicken and egg exercise. Bureaucrats predict increasing car usage and call for more roads to handle the additional traffic. New roads result in an induced demand for people to drive rather than taking public transport. The forecasts become a self-fulfilling prophecy, and meanwhile the additional traffic mean a return to the congestion that the new roads were meant to eliminate.

Google has added bike paths to its Google Maps service. You can now plan your trip to take bike paths into account. They are separated into off-street, on-street and “bike friendly streets”.

Google Maps bike paths

Some quick browsing through it reveals that it is still a work in progress, with some bike paths missing or inconsistent (i.e. in some places a shared pedestrian/bike path is classified as off-street and sometimes as on-street). Still, this is a big improvement, along with the addition of traffic that was added recently.

What Google Maps is still missing in Australia is good Google Transit functionality. It’s almost non-existent in Australia, with Sydney having only the light rail and monorail built in. Sydneysiders can use something like 131500 or the TripView app to get directions, but I found neither of them to be as user friendly as Google Transit was when I used it while travelling in the US.

Submissions to the Transport Masterplan were due by midnight tonight.I’ve included my submission to it below. The questions are in bold, with my responses in after that. I got in with an hour to spare. It’s quite long, so if you just want the highlights, read my responses to the second and last questions.

TRANSPORT OBJECTIVES : Are the objectives for future planning for transport in NSW appropriate and comprehensive?

Overall the discussion paper is quite comprehensive, and I’m generally quite happy with the direction that it lays out for transport in NSW.

TRANSPORT OBJECTIVES : Do you have any other objectives to suggest for both public transport and roads?

A number of issues were not raised in the discussion paper (or I could not find them):

1. Congestion charging and uniform tolling. Currently there are countless different tolling systems throughout Sydney, ranging from free to distance based to flat fee to time of day. There is a significant potential to set tolling in such a way as to provide funding for additional transport spending AND as a form of congestion charging to discourage private car use during peak hour.

2. Car share. This has taken off in the inner city parts of Sydney, with some limited expansion into the North Shore and Parramatta. Though it is supported at the local council level, there is huge scope for car share policy to be expanded to the city-wide level in order to encourage take up, and thus discourage car ownership/use.

3. Bike share. As a “last mile” strategy, bike share can greatly expand the catchment area of public transport by allowing commuters to ride a bike after alighting from their public transport vehicle. This is a much better option than encouraging commuters to take their own bike on buses/trains, as this uses up valuable space onboard the vehicles. Helmet laws should be considered, and if any rollout is ever done then it should be done at a large scale. Small scale bike share schemes have been shown to fail due to insufficient coverage (e.g. Melbourne) whereas successful schemes invested in a substantial and wide fleet of bikes (e.g. Paris and London).

SYDNEY TRANSPORT : In solving the transport problems in Sydney, what transport mode should be the first priority for new investment, bearing in mind the need for a socially equitable and environmentally sustainable transport sector?

Transport modes are a transport solution to a transport problem. To pick a mode first is putting the cart before the horse, as it seeks to pick a solution and then go looking for a problem. Ideally we should be highlighting the problems and then selecting the most appropriate solution (and hence transport mode), which will be different depending on the exact problem. In some cases, the solution may be buses, in some cases it may be rail, in some cases it may be a re-organisation or upgrade of existing services.

But the key thing is to work out the problem first, and find a solution second.

SYDNEY TRANSPORT : What do you consider to be the main priorities for investment in Sydney’s transport infrastructure?

Public transport should be a priority. In the last 2 decades, many public transport projects have been deferred or cancelled. Meanwhile, every single new freeway that has been proposed has also been built. Freeways need to go to the bottom of the pile for the next 20 years in order to being public transport infrastructure back to square one.

SYDNEY TRANSPORT : How can the road network be better utilised and enhanced?

Get people out of cars and into public transport or out of the peak and into the off-peak. There is enough existing road capacity out there to transport Sydney’s population without having to build more roads.

There are many roads that are currently used for travelling through, rather than used for arriving at a final destination. For example, many people drive through the CBD without actually stopping there. This sort of traffic belongs on a freeway of some sort. Perversely, there is a freeway that people could take (the Cross City Tunnel), yet people choose not to use it because there is a toll. A logical solution would have been to toll the surface roads via a congestion charge, which would then fund a free CCT journey.

SYDNEY TRANSPORT : What are your priorities for public transport services in terms of frequency, reliability, cleanliness and safety?

Frequency is freedom. I love turn up and go public transport that is frequent enough that I don’t need a timetable. Depending on the context, this may mean 5, 7, 10, 15 or even 20 minute frequencies.

SYDNEY TRANSPORT : What criteria should determine whether light rail or bus transport should be preferred?

Light rail has a few benefits over buses, such as higher capacity, more popular appeal, faster acceleration/deceleration, less noise, certainty, etc. However, many of the benefits normally attributed to light rail, such as exclusive rights of way of better stops/stations, are actually also available to buses and are not technology based. Such things should not be considered when deciding between the two technologies.

SYDNEY TRANSPORT : What are the current barriers to using multiple transport modes to complete a journey? How can the barriers be addressed?

Integrated fares exist with myMulti tickets, but they are limited to weekly tickets and are CBD centric (a daily ticket also exists, but is far too expensive for all but a few users). Additional myMulti tickets should be available, such that Zones 1, 2, 3, 1+2, 2+3 or 1+2+3 are available, for users in outer suburbs who do not commute into the CBD.

Fares should cost the same to get from A to B, regardless of the number of vehicles used to do so. Currently, using 2 vehicles costs more, despite the fact that this is an inconvenience, not a premium service as the cost would suggest.

Resolving this can take either the form of point to point fares (which can be done once Opal is rolled out) or simple zonal fares (as myMulti tickets operate). Either is fine, but whichever option is taken the fare system should be built up from the ground up to be simple. Grandfathering the existing fare structure would complicate things unnecessarily.

SYDNEY TRANSPORT : How can the transport requirements of Sydney Airport and Port Botany be best addressed?

A second airport should be built at Badgerys Creek, where the joint NSW-Federal study into a second airport recommended it be built, in order to relieve the pressure on Kingsford Smith Airport and to provide jobs to Western Sydney, where the majority of the population growth will occur.

SYDNEY TRANSPORT : If there are to be more greenfield land release areas in Sydney, should there be a focus on developing public transport options as part of strategic land use planning for Metropolitan Sydney? How should this policy be given effect?

Future developments should be designed more like Rouse Hill, which has a dense town centre at its core which acts as a transport hub/interchange, rather than Kellyville, which is streets upon streets of houses and little else, forcing residents into their cars as the only transport option. Such a strategy, along with reservations for future rail corridors, allows for buses to serve these new areas until sufficient population/funding is available to extend heavy rail into the area.

Good planning for public transport also increases land value, and accessing some of the increase in the value of the land can help to fund this new transport infrastructure through, for example, additional levies on developers of these greenfield sites.

REGIONAL TRANSPORT : What are the key transport objectives for your region?

Rail lines have been poorly maintained and trains today run no faster than they did for most of the past century. There is little reason why trains in non-urban areas should not be able to go at 160km/hr (the maximum speed of an XPT train). Such an improvement could make living in Wollongong or Newcastle and commuting into Sydney a viable option, or getting a train between Sydney and Canberra competitive with air travel.

FUNDING : How much would people be prepared to pay for further investment in the transport system and what would be the expectation flowing from these investments?

I can’t put a number on this, or speak for the entire population of NSW. But there does seem to be an increased appetite for government spending on critical infrastructure, such as transport infrastructure, given the infrastructure deficit that has built up over recent years and the cost pressures that it has caused.

FUNDING : Given the limitations on funds available for future transport investment, what mechanisms should be employed to manage demand?

Congestion charging could help to manage private vehicle flows to limit congestion.

Also, encouraging employment in centres outside of the CBD, to make use of existing capacity on public transport from vehicles going in the counter flow direction during peak hour could allow unused capacity to be used, rather than having to invest in increasing existing capacity.

FUNDING : Should new revenues or charges be explored to deliver the transport infrastructure needs within a realistic timeframe?

Absolutely. Now is not the time to be ruling things out.

FUNDING : If further road user pricing were to be introduced, how should this operate? For example, by distance travelled? By vehicle type? Or should it be area based?

Distance travelled is a much more effective method of tolling, now that the technology exists to do it that way. Time of day tolling (congestion charging) should also be considered, as a way to discourage peak hour traffic and also to fund additional transport infrastructure.

OTHER COMMENTS : Are there any other comments about the NSW Long Term Transport Master Plan Discussion Paper that you have?

The federal government is currently offering $2.1 billion in funding for public transport. Unfortunately, due to the political constraints of neither the state nor federal governments wanting to break a political promise, this $2.1 billion is not currently available. At a time when so much infrastructure needs to be built, losing this funding should not be considered an option.

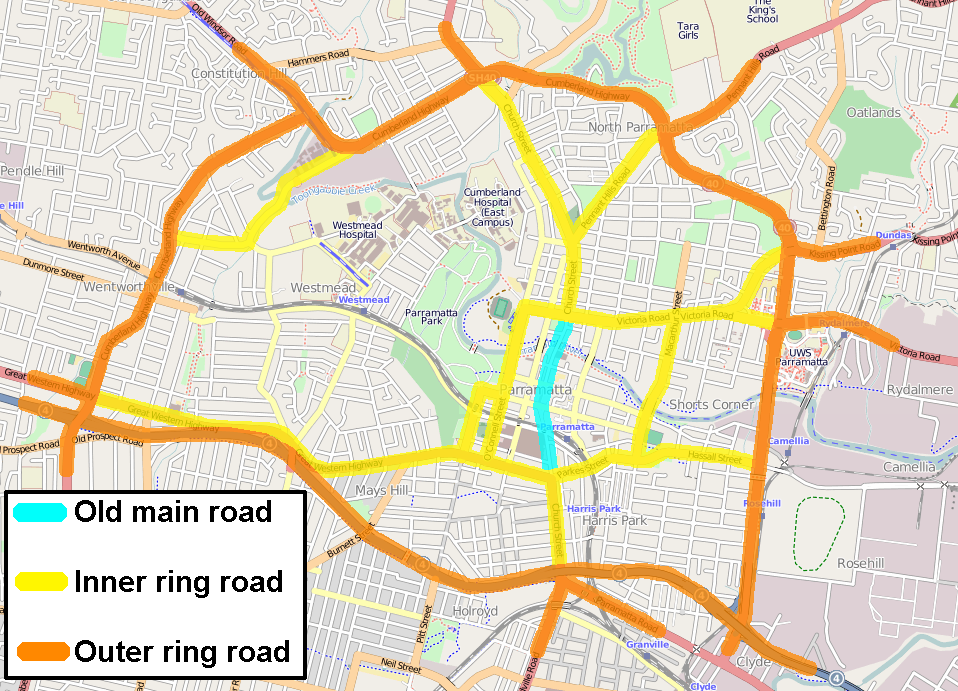
It is therefore imperative that the NSW government do what it can to negotiate a compromise solution to this problem. This could involve offering to build some sort of high capacity transport link between Parramatta and Macquarie Park, which could be done at a fraction of the cost of the Parramatta to Epping Rail Link and thus allow the construction of the Northwest Rail Link (which is the current government’s priority). A number of proposals to do this (through BRT, light rail, etc) are currently on the table, and ultimately I care less about the option taken as I do about a compromise being struck.

But the worst outcome would be for both governments to stick to their guns, because then we all lose out.

The finalisation of the new transport master plan for NSW is one step closer, with the release of a discussion paper outlining the current context and key challenges for transport in NSW. The next step is public consultation on the masterplan, which will be considered and incorporated into the actual masterplan that is to be finalised later this year. To make a submission, you can contact Transport for NSW on masterplan@transport.nsw.gov.au by 27 April.

The key points raised in the discussion paper (relating to commuter transport in Sydney – I have skipped over freight and rural transport), along with the page references are covered below. The main points that I thought were missing, and will mention in my submission, are congestion charges for driving in the CBD and bike share, both of which I discuss briefly below.

Introduction

There are a number of corridors in Sydney which will see capacity constraints over the next 20 years. These include (1) CBD to Northern Beaches, (2) CBD to Inner West, (3) CBD to the airport, (4) airport to South-West Sydney, and (5) Macquarie Park to the Northwest Growth Sector (pp. 39-40).

Corridor capacity constraints over next 20 years

Click on image for higher resolution. (Source: NSW Long Term Transport Master Plan Discussion Paper, page 40.)

530,000 new jobs will be created in Sydney in the next 2 decades, 50% in Western Sydney and 20% in the global economic arc covering the Macquarie Park -Chatswood-St Leonards-North Sydney-CBD-airport are (p. 34).

When deciding what should be done in order to meet transport needs, the first priority should be small enhancements to existing infrastructure (such as track duplications, platform extensions, creation of bus lanes, improved timetables, better interchanges, etc) to deal with bottlenecks/pinchpoints rather than expensive construction of new infrastructure. Where this cannot be done, new infrastructure should be the solution (p. 41). All current projects across Sydney are also displayed:

Current transport projects 2012

Click on image for higher resolution. (Source: NSW Long Term Transport Master Plan Discussion Paper, page 14.)

Integrated transport system

To be successful, the transport system in Sydney needs to be a single integrated network, rather than a patchwork of competing networks that do not allow for an easy and simple trip from point A to point B. To this extent, the NSW government has created a new transport authority: Transport for NSW (seemingly modelled on Transport for London) which puts customers at the centre of planning and decision making (p. 3). It also accepts that an integrated public transport system uses buses and light rail to compliment and support the heavy rail system, rather than compete with it (p. 3).

Roads and driving

The freeway network in Sydney still has a few missing links, including the M4 East between Strathfield and Sydney Airport/Port Botany/Sydney CBD, a connection between the Sydney Orbital on the M2 and the F3 at Hornsby, and the Sydney Orbital on the M5 and the F6 in the South (p. 46).

The discussion paper was noticeably silent on the issue of congestion pricing for the CBD, which has been used in places like London to reduce traffic congestion and act as a source of revenue for public transport.

Heavy rail

The Cityrail network is quite extensive, with half of all residents living within 2km of a train station and half of all jobs being within 1km of a train station (p. 58). But while coverage is quite extensive, the network is fast approaching capacity constraints, and the discussion paper says a few things about how the heavy rail network can be made to run more efficiently:

One way of tailoring services to customer needs is to separate services so that the high frequency all-stop services can operate on different tracks to the express services. This can be achieved through improved timetables linked to the development of new rail infrastructure projects. Timetables need to be customised to the different needs and priorities of customers. Increasing the frequency of trains will reduce crowding and speed up journey times. Increased service frequencies will enable those making short trips within inner Sydney, such as on the Inner West, Illawarra and Bankstown Lines, to ‘turn-up-and-go’ without needing to consult a timetable.

Sydney has a highly complex rail network. Fifteen outer lines feed into eight inner lines, which in turn feed into six lines converging through the Sydney CBD. This results in constraints where rail lines converge. Further consideration about how to separate major lines is required.

Automatic Train Protection and Automatic Train Operation systems can be used to automate acceleration and deceleration of trains as well as manage the distance between them. These systems increase safety and can enable increased capacity on each line. Automatic Train Protection is currently being introduced to the rail system and a trial of Automatic Train Operation [i.e. driverless trains] will be undertaken to test the capacity that could be gained. These systems will support the improvements in timetables to increase frequency and reduce journey times. (p. 43)

Single deck metro style trains and a second harbour crossing are also discussed, almost to the point where it seems like a certainty that these change will be occurring and that the only question is when, not if (p. 45).

Rail infrastructure construction timeline

The SWRL, NWRL and City Relief Lines appear to be the next 3 major expansions to the Cityrail network. After that it’s a question of which order a second harbour crossing or metro conversion will occur, not whether either or both will occur. Click on image for higher resolution. (Source: NSW Long Term Transport Master Plan Discussion Paper, page 45.)

Light rail

Any new light rail lines constructed in the inner city will be designed to fit in and compliment the bus and train network rather than to compete with it. As a result, it will replace a number of bus routes and see a redesign of the bus network to fit in with light rail (p. 49).

Buses

There is currently a significant amount of congestion in the CBD caused by buses, particularly around Wynyard (from the Harbour Bridge) and Circular Quay (via the CBD). A short term solution of re-routing some lines is provided (p. 48), though nothing is mentioned about long term solutions (though this is likely to involve replacing buses from the Northwest with trains on the Northwest Rail Link and buses from the Eastern Suburbs with light rail). Nor is there any mention of re-organising bus routes to have them travel through the city (as many metrobuses currently do), rather than merely terminating at one end of it, which could potentially eliminate about half the buses travelling through the CBD itself.

Ferries

The ferry system is to be privatised, starting with new private routes that were recently announced, then followed by franchising out the government owned Sydney Ferries to a private operator (p. 51).

There was no mention of any other possibilities of privatisation, such franchising out any potential future metro style rail network or for private operation of the Northwest Rail Link, both of which have been rumoured in the press.

Cycling and walking

Both cycling and walking are also said to need to be promoted, but nothing is mentioned about integrating it with rail as was mentioned with buses and light rail (p. 5). Significant work has been put on constructing large (and expensive) park and ride facilities to allow commuters to drive and park their car to the local train station, but relatively little for cyclists to ride their bike and store it before getting on the train, which could significantly increase the catchment area around train stations for people who live too far to walk, have limited bus connections and/or do not to drive to the station for whatever reason.

Also not mentioned is bike share (p. 52). Such a scheme was implemented in Melbourne (600 bikes) and Paris (20,000 bikes), but to a much lesser extent in Melbourne than in Paris and therefore never quite reached a critical mass for it be as successful as it was in Paris (click on the link to read Alan Davies’ article about it at The Melbourne Urbanist). Obviously, one challenge to bike share in Australia is the mandatory helmet laws. That aside, imagine how much easier it would be if you could ride your bike to the train station, leave it in a locker, catch the train into the city, then hire one of the bike share bicycles to get you to your final destination. (A similar outcome can be achieved by transporting bikes on buses/trains, but this only works if few people do it and is therefore not scalable to being done by large numbers of people.) This leads to an increase in the area which you can get from and to the train station at both ends of your journey, making public transport a much more attractive option. Jarrett Walker over at Human Transit refers to this as the “last mile issue” and has some interesting further reading on the topic.

One of the spill-over effects of the cost blow-out and delay to the light rail extension to Dulwich Hill has been the indefinite deferral of the Greenway that was to run parallel to the new line, allowing people to travel on bike and foot along Sydney’s Inner West. Initially believed to be because of the cost blowout, it now turns out that the deferral (in effect a cancellation) was in order to prevent the construction schedule from blowing out any further, rather than a purely financial decision. While it would have been cheaper to build both at the same time, it’s clear the new Liberal government wants to avoid any further embarrassment from a delay to this project, given they criticised the previous Labor government so much for all the delays to transport projects under their watch.

Greenway map

A map of the Greenway. Click on image for high resolution. (Source: http://www.greenway.org.au)

A community lobby group, the Friends of the Greenway, has been pushing for the government to reverse this decision. The group, which had previously been pushing for changes to the design, has taken on a whole new direction in light of the cancellation of this project.

All this could be solved if construction could be completed to the original schedule. Why a 5.5km extension on a pre-existing right of way, where the tracks have already been laid, and all that is required is to put up some overhead wiring and build a few new stations is going to take over 2 years still astounds me. There is no logical reason in my mind why this new line shouldn’t be up and running in 2012. Solve that, and all this should we/shouldn’t we argument over building the Greenway becomes completely irrelevant.