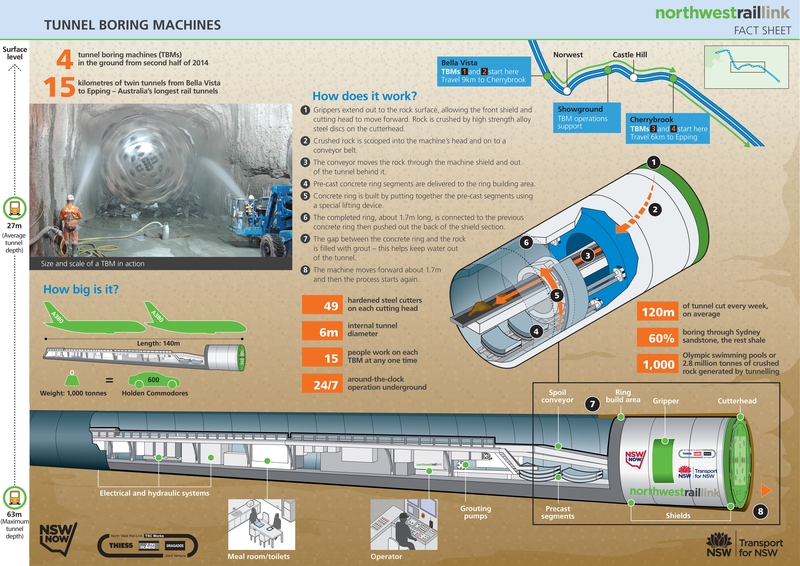
4 tunnel boring machines like these will be used on the NWRL. Click to enlarge. (Source: Transport for NSW)
Questions about the decision to build the tunnels for the North West Rail Link (NWRL) too narrow and too steep for existing Cityrail rolling stock have resurfaced as the government signs the tunnel boring contract for them. Transport Minister Gladys Berejiklian had already admitted that any savings from narrower tunnels on the NWRL would be outweighed by the costs of retrofitting the existing Epping to Chatswood Line, but it now appears likely that one of the bidders for this contract had offered to bore the tunnels at the larger diametre for the same price.
https://twitter.com/jetpack/status/349313272446595072Rumours of this have been circulating, and were first raised in this blog last month on 29 May in the comments section:
“I heard that one company that tendered offered to bore the tunnels to the regular specification for double deckers at no extra charge to facilitate future integration and they were told to go away.” – Joni (29 May 2013)
It was then put to Ms Berejiklian during question time last week. She was asked whether she had received such advice, a question which she dodged in her response. Her refusal to deny it strongly suggests that she has received such advice. The response did, however, contain one of the best interjections made during questions time, by Labor MP Richard Amery:
Mr MICHAEL DALEY: My question is directed to the Minister for Transport. Given the budget appears to confirm that the North West Rail Link will be nothing more than a privatised shuttle service, has the Minister received any advice that the tunnels for the North West Rail Link could be bored to a width that would accommodate double-deck trains at no additional cost to the project?
Ms GLADYS BEREJIKLIAN: Members of the New South Wales Labor Party should hang their heads in shame in relation to the North West Rail Link.
Mr Richard Amery: We’ll have to, to get through the tunnel.
The logical conclusion from this is that the government’s decision to proceed with narrower tunnels is not due to financial considerations. Instead, it is to guarantee that the NWRL remains a segregated, privately operated system that does not interact with the existing Cityrail network.
This is the dominant vision of the transport planners at Transport for NSW, and has been ever since 2008 when they convinced the state government to build a completely segregated metro line from the CBD to Rouse Hill (since abandoned and replaced with a cheaper option that also uses portions of the existing network rather than building completely from scratch). This would prevent the new line from being operated by Railcorp, an organisation that is seen by these planners as slow, inefficient, expensive, and lacking a user (i.e. passengers) focus. Ms Berejiklian often cites that it costs $10m per day to operate, about the same as the London Underground but with about a quarter of the patronage. She is therefore leading a structural reform of Railcorp, with the creation of Sydney Trains and NSW TrainLink, but simultaneously also pursuing the option of a completely new line operated by “anyone but Railcorp”.
The decision to make the tunnels narrower and steeper guarantees the independence of this new line, ensuring that the private operator can be held entirely accountable without being able to blame the government rail operator (e.g. because a delay on Sydney Trains prevented the private operator from running on time), while also neutering union opposition to advancements like driverless trains. It is the poison pill that prevents any future government from having a change of heart and integrating the NWRL into the rest of the Cityrail network. Their fear is that a future government could do this in order to, for example, once again scrap the construction of a Second Harbour Rail Crossing, a project announced and subsequently abandoned so many times that transport planners may have found a way of ensuring it gets built – by holding another line hostage in the process.
Nor would wider tunnels necessarily be some silver bullet, the tunnels would still be too steep for existing rolling stock. And it’s worth remembering that any future tunnels under the Harbour (the government is planning its Harbour Rail Crossing to be an under the Harbour tunnel) may also have to be quite steep and the existing tunnels between Epping and Chatswood are already too steep for some existing rolling stock, resulting in new rolling stock like the Waratah trains being built to be compatible with the steeper gradient. Similarly, there are few technical barriers to prevent future double deck rolling stock designed to navigate the narrower and steeper tunnels on the NWRL. But it will prevent that from happening long enough to see whether private operation of heavy rail results in better outcomes, and should be expanded; or is a repeat failure like the privately owned Airport Line, and should not be repeated.
Correction: It’s been pointed out that Tangaras, although not initially used in the Epping to Chatswood tunnels due to their steepness, now are used in them. This is confirmed by the proposed October 2013 timetable. In other words, rolling stock that was not initially able to be used on the Epping to Chatswood tunnels were later able to be used in those tunnels. This is consistent with restrictions on existing rolling stock on the NWRL tunnels, where future changes could also allow double deck trains to still be used on them.