Posts Tagged ‘Parking’

Note: For the second time this year, this blog has taken an unannounced hiatus for a number of months due to the pressures of real life. This post was written up at the end of June but never properly finished and thus not posted. It will probably be the final monthly round up, at least for the foreseeable future. This blog will not be ending, posts will still continue. But instead, the focus will be on specific issues or events as they occur with no set frequency of posts. For now, please enjoy the breaking news from 3 months ago…

VIDEO: Urban Taskforce Research- Who Lives in Apartments (31 May 2015)

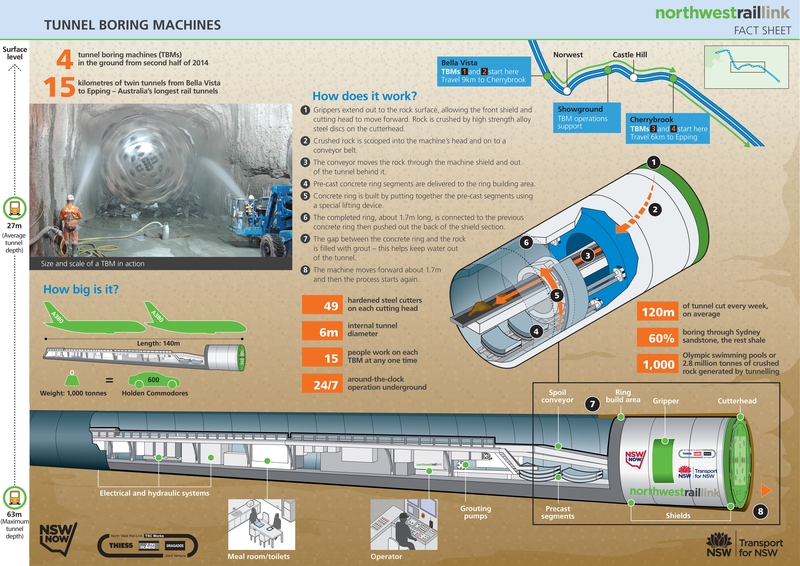
2 June: $50m cost blowout for NWRL

The budget for constructing the skytrain portion of the North West Rail Link, an elevated viaduct between Bella Vista and Rouse Hill, has blown out from $340m to $390m. Despite the cost blowout, a project spokesperson said that there has been no change to the completion date for the skytrain, while the Transport Minister Andrew Constance stated that variations in cost had been factored into the full $8.3bn budget and that the overall budget remained unchanged.

The skytrain portion of Sydney Metro, shown at the proposed Rouse Hill Station. Click to enlarge. (Source: Transport for NSW.)

The skytrain portion of North West Rail Link, shown at the proposed Rouse Hill Station. Click to enlarge. (Source: Transport for NSW.)

 4 June: Sydney Rapid Transit renamed Sydney Metro

Sydney’s single deck train network will be known as Sydney Metro, replacing the previous name Sydney Rapid Transit. This follows the passage of legislation authorising the privatisation of state owned electricity assets, which passed both chambers of Parliament the previous day.

4 June: NSW Opposition dumps support for light rail because of Infrastructure NSW Report

The new Shadow Transport Minister Ryan Park, who together with the Opposition Leader Luke Foley recently withdrew their support for light rail down George Street, announced that the change of heart on light rail came after reading the 2012 Infrastructure NSW Report that opposed George Street light rail. The alternative bus tunnel option suggested by the report was criticised by Transport for NSW, with Infrastructure NSW later supporting George Street light rail.

A very early proposed map for the CBD BRT would see a tunnel between Wynyard and Town Hall, removing many buses from the surface streets. Click on image for higher resolution. (Source: First Things First, Infrastructure NSW, page 99.)

A very early proposed map for the CBD BRT would see a tunnel between Wynyard and Town Hall, removing many buses from the surface streets. Click to enlarge. (Source: First Things First, Infrastructure NSW, page 99.)

6 June: Transport corridors in Western Sydney to be reserved

Work to reserve transport corridors in Sydney’s West for an Outer Sydney Orbital motorway, Bells Line of Road to Castlereagh Connection, and South West Rail Link extension is moving into the public consultation phase. The NSW Roads Minister Duncay Gay said that work on the 2 roads was not expected to begin for decades; with the SWRL corridor set to be identified by late 2016.

8 June: Olympic Park becomes preferred light rail option

A light rail line connecting Parramatta to Olympic Park has firmed as the favourite option for a new light rail line in Sydney’s West. The line could extend out to Wesmead in the West and Strathfield in the East. It gained favour after a campaign by businesses and developers who touted the possibility for development of the corridor and the potential for value capture from that development to fund the cost of building the new line. However, local councils have labelled the line a white elephant and are calling for the Government to build a line to Epping instead.

11 June: Opal only gates installed at Wynyard Station

New Opal only gates have been installed as part of the Wynyard Station upgrade. Opal only gates have recently been installed at Olympic Park Station. No date has been set for the full phase out of ticket gates that accept magnetic stripe paper ticket.

https://twitter.com/TheOpalUser/status/608901203326423040

12 June: SWRL connection to CBD via Granville?

Transport blogger Nick Stylianou suggests that Leppington trains may be connected up to the T2 South Line, travelling to the CBD via Granville. This may happen as soon as the end of this year, with Campbelltown to city services running exclusively on the T2 Airport Line.

https://twitter.com/kypros1992/status/609128666828705792

12 June: 65 new transport officers

Sydney’s existing 150 transport officers is set to increase to 215, with an additional 65 transport officers to be hired.

15 June: Trial of backdoor boarding on CBD buses

The Government is set to trial boarding of buses via the back door for 2 weeks. The trial will be restricted to Opal card users between 4PM and 7PM at 7 bus stops in the CBD. Marshals will be present to ensure boarding occurs safely. It is hoped that the trial will see lower dwell times for buses by allowing customers to board more quickly.

VIDEO: Seven News Sydney – Trial of back door loading on buses (15/6/2015)

19 June: Reduction in minimum parking requirements

The NSW Government has announced a watered down version of a minimum parking requirement policy that it announced last year. The new policy allows new apartment blocks in areas well serviced by public transport to have fewer off-street parking spots than is currently mandated by local government regulations. The previously announced policy would have eliminated the requirement for off-street parking entirely and has not been adopted. Supporters of the move argue that it will help to keep construction costs down and help with housing affordability. Opponents of the move claim that it will cause cars to spill over into existing streets where parking is already scarce.

23 June: Barangaroo Station confirmed

A Station at Barangaroo has been confirmed in the Sydney Metro City and Southwest. Stations still to be determined are Artarmon, St Leonards/Crows Nest and either Sydney University or Waterloo.

VIDEO: Sydney Metro Barangaroo Station

VIDEO: Man races a train to the next stop

Tuesday: Parking minimums for new developments scrapped

New developments near transport hubs in and around the inner city will no longer be required to include parking spaces as part of government reforms to planning laws. Including a parking space can add an additional $50,000 or more to the cost of a unit, with the changes designed to allow inner city residents who do not need or want a parking space from being forced to pay for one. Developers can still choose to include parking spaces, should market demand for them exist. Opposition to the plan prevented it from being extended to outer suburban locations, with critics worried that it would result in cars spilling over into streets and using up the limited amount of available on-street parking in the inner city.

Tuesday: Replacement Epping to Chatswood Line bus routes announced

Five indicative bus routes have been identified which will run while the Epping to Chatswood Line is shut down during 2018 and 2019. The line is being upgraded as part of the North West Rail Link and will not operate for 7 months. During this time, additional bus services will operate to connect the T1 Northern Line and T1 North Shore Lines that are currently linked by rail between Epping to Chatswood.

5 bus routes will replace the Epping to Chatswood Rail Link in 2018 and 2019 during the 7 months that it is being upgraded as part of the North West Rail Link. Click to enlarge. (Source: Transport for NSW.)

5 bus routes will replace the Epping to Chatswood Rail Link in 2018 and 2019 during the 7 months that it is being upgraded as part of the North West Rail Link. Click to enlarge. (Source: Transport for NSW.)

Thursday: Registration of Interest for Maldon to Dombarton Line opens

Update: Northern Line added (10:52PM, 28/09/2014)

The NSW Government has called on private sector investors to show their interest in building and operating the 35km Maldon to Dombarton Rail Line. The freight line would connect Port Kembla in Wollongong to the Southern Sydney Freight Line, potentially removing freight trains from the T4 Illawarra Line that currently travel via Sutherland to reach Sydney from Port Kembla. This could mean a completely segregated freight and passenger rail network in metropolitan Sydney outside of the Western Line and Northern Line, much of which consists of 2 pairs of tracks and can better handle disruptions to passenger services caused by broken down freight trains, while also allowing more freight to operate during the busy commuter peak hour during which curfews are in place for freight trains on much of the passenger network.

Construction on the Maldon to Dombarton freight line began in 1983 but was never completed due to an economic downturn and the forecast growth in coal traffic not eventuating.

Saturday: Rail line building plan to be scrapped

Plans to build high rise buildings close to the CBD by utilising the airspace above the rail line between Central and Redfern Stations looks set to be abandoned. The plan has proven to be too risky and too expensive. This made it unlikely that the private sector would be willing to bear the risk of the project, leaving the Government the risk burden. The plan, which would also contain a redevelopment of industrial areas on either side of the rail line near Redfern, had been compared to Barangaroo in size and scale.

Finance reporter Alan Kohler wrote yesterday about how he believes clearways, the removal of on-street parking from major roads to improve traffic flow, are needed outside of peak hour as congestion problems now last well outside of peak hour; particularly so on weekends. In many cases a 4 lane road dedicates 2 lanes to parking, which restricts the maximum capacity by 50%. Rather than building expensive new roads, Mr Kohler opines that a better option would be to unlock this existing capacity.

Mr Kohler is right about one thing, this is definitely a much cheaper way of improving road capacity than building new roads. Sydney’s WestConnex and Melbourne’s East-West Link alone are reported to cost $11.5bn and $18bn each, with State and Commonwealth Governments contributing a combined $9.3bn to the road projects so far. But removing on-street parking will only dramatically improve traffic flows if parking is the major bottleneck. In many cases, removing on-street parking can just see it replaced by intersections and bus stops as the bottleneck.

Removing on-street parking removes one bottleneck, but often only sees it replaced with other bottlenecks. Bondi Road, nominated as a possible all day clearway by the NSW Government, shows how bus stops without bus bays and intersections without turning lanes can cause through traffic to get stuck behind buses and other cars when clearways are introduced. Click to enlarge. (Source: Google Maps, modified by author.)

Removing on-street parking removes one bottleneck, but often only sees it replaced with other bottlenecks. Bondi Road, nominated as a possible all day clearway by the NSW Government, shows how bus stops without bus bays and intersections without turning lanes can cause through traffic to get stuck behind buses and other cars when clearways are introduced. Click to enlarge. (Source: Google Maps, modified by author.)

A major road without additional turning lanes at intersections can see delays as through traffic is delayed by cars waiting to turn. However, because parking is not allowed near intersections, this effectively creates turning lanes. Thus, through traffic does not get stuck behind cars waiting to turn. This isn’t particularly problematic during peak hour as most traffic is through traffic headed towards a few major centres . However, outside of peak hour and on weekends in particular trips tend to be dispersed and this encourages more turning movements rather than through traffic. The effect of this is to enhance the benefit of clearways during peak hour but diminish it outside of it.

The absence of bus bays can also cause through traffic to get stuck behind buses picking up or dropping off passengers at bus stops. With on-street parking, bus zones act as de facto bus bays, allowing buses to pull in and allow through traffic to continue undisrupted. However, unlike turning lanes, this is a bigger problem during peak hour when buses are more frequent.

(There are alternatives to improving traffic flows. Putting aside additional investments in public transport to encourage car users out of their cars and into public transport or even considering bus lanes rather than clearways, the best way to allocate scarce resources is to put a price on it – in this case by pricing both driving and parking. Alan Davies has written on road pricing here and here, while Paul Barter explains how better pricing of parking can cut congestion.)

Extending clearways by removing on-street parking can improve traffic flows, but not all of the time. Care needs to be taken to ensure that doing so will actually improve traffic flows and not just replace one bottleneck with another. The best possible outcome is that these are considered on a case by case basis to improve traffic flows where it is possible rather than where it is not. The worst possible outcome would be that this does little to improve actual traffic flows but instead gives the impression that it will, encouraging extra road users into their cars and thus worsening traffic congestion.

VIDEO: TBM1 Elizabeth assembly and start of tunnelling, Transport for NSW

Monday: NWRL tunneling begins 4 months ahead of schedule

The first of 4 tunnel boring machines (TBM) began work on the 15km twin tunnels that will form the core of the 23km North West Rail Link. Tunneling was expected to begin by the end of this year. The current TBM, along with a second when it is ready, are beginning from Bella Vista and will cut a pair of 9km tunnels through to Cherrybrook, where a second pair of TBMs will cut another pair of 6km tunnels to Epping.

Tunneling is likely to take about 2 years, with station and tunnel fit outs to take an additional 2 years, and a final year to bring the line to operational rediness in time for a 2019 opening.

4 tunnel boring machines like these will be used on the NWRL. Click to enlarge. (Source: Transport for NSW)

4 tunnel boring machines like these will be used on the NWRL. Click to enlarge. (Source: Transport for NSW.)

Monday: Sydney Trains cancel cleaning contract midway through

An agreement with Transfield to manage cleaning services for Sydney Trains has been cancelled 2 years into the 4 year contract. The cleaning will still be contracted out, but the management of the private contractors has been brought in house within Sydney Trains.

Thursday: Opal bus rollout two thirds done

Opal readers have been enabled on buses in Sydney’s Inner West as well as in the lower Hunter region. This brings the number of Opal enabled buses up to 3,290. There are 5,000 buses in NSW that are on track to be Opal enabled by the end of the year.

850,000 Opal cards have been issued, a large increase on the 500,000 Opal cards that had been issued at the start of August.

Friday: Granville parking and bus interchange upgrade complete

Granville Station’s bus interchange upgrade has been completed, along with an increase in 40 car spaces for commuter parking. Construction on an additional 20 car parking spaces is also planned to commence soon.

Saturday: SWRL completed, will open in early 2015

The South West Rail Link has been completed a year ahead of schedule and $300m under budget. The line was originally announced in 2005, with a $688m budget and an expected opening date of 2012. However, by the time it had been scheduled to be completed in 2012, the budget had blown out to $2.1bn and the opening date pushed back to 2016.

The line will be opened early next year, with January being rumoured as the planned date. The new line’s timetables and operating patterns will be worked out between now and when it is opened.

Map of the SWRL. Click to enlarge. (Source: Glenfield Transport Interchange Review of Environmental Factors, page 2)

Map of the SWRL. Click to enlarge. (Source: Glenfield Transport Interchange Review of Environmental Factors, page 2)

VIDEO: South West Rail Link complete, Seven News (14 September 2014)

Tuesday: Opal Man cost $100,000 to design

The NSW Government paid $100,000 to design Opal Man, according to documents obtained by Shadow Transport Minister Penny Sharpe. This has been followed by a multimillion dollar advertising campaign, including $2.3m to develop TV ads and a further $4.7m in buying spots on the media. In addition, $2.9m is being spent on information and sales staff at stations.

Wednesday: Randwick Council signs agreement with NSW Government over light rail

Hundreds of parking spaces are to be retained or replaced in Kensington and Kingsford along Anzac Parade when light rail is built along that road as part of a Development Agreement between Randwick Council and Transport for NSW. The agreement, which follows a lengthy and politically disputed period of many months, will return 100-120 parking spots on Anzac Parade during off-peak hours. Previous plans were to have turned Anzac Parade into a 24 hour clearway with no parking. The agreement will also see the sale of land near the Kingsford interchange to Randwick Council, which the council plans to turn into a car park to offset the loss of parking spaces from the construction of the Kingsford interchange over the existing parking lot adjacent to South’s Juniors.

The revised Randwick light rail interchange features 3 times as much green space as originally proposed, but this is still half as much as is currently there. Click to enlarge. (Source: CSELR Submissions Report, p. 6-65)

The revised Randwick light rail interchange features 3 times as much green space as originally proposed, but this is still half as much as is currently there. Click to enlarge. (Source: CSELR Submissions Report, p. 6-65)

The agreement also requires Transport for NSW to consider alternative options for the Randwick interchange planned at High Cross Park, though stops short of requiring Transport for NSW to modify it should no alternative be found to be feasible. It also requires an independent arborist to be consulted if the removal of any trees is disputed.

Public transport advocacy group EcoTransit has put forward a public transport alternative to the M4 East component of the WestConnex. A new train station on the Eastern end of the M4, next to a large car park in Olympic Park, with trains into Central Station, along with a light rail network, would provide sufficient relief so as to avoid the need for building the M4 East, according to a video it released called “WestConnex — Greiner’s folly Part 3”  (part two of this series have been covered previously on this blog, part one can be viewed here). It also claims to be able to do so at a much cheaper cost of $2.2bn, compared to $8bn for the M4 East.

The video is included below and worth watching. You can also subscribe to the EcoTransit YouTube channel to receive updates when new videos are uploaded.

VIDEO: WestConnex — Greiner’s folly Part 3, EcoTransit

The new train station, named Pippita Station by EcoTransit, would be above the M4 along the existing Olympic Park Line and adjacent to an existing car park currently exists for sporting events with what appears to be (using a back of the envelope estimate) 1,000 to 2,000 car spaces, These spaces tend to be used in the evening and weekends, and remain mostly empty during work hours when commuters making their journey to and from work would need a parking space. There are also enough free slots on the Main West Line tracks between Lidcombe and Central, as well as the Sydney Terminal platforms at Central Station, for a train every 15 minutes into Sydney Terminal.

But the reality is not so simple, and this may not necessarily prove to be the magic bullet solution it initially appears to be.

It’s worth remembering that there are currently park and ride facilities across the Sydney Trains network, and if these car drivers are not using them at the moment, it is questionable what difference adding an extra park and ride facility would provide (particularly considering that it would require a second transfer at Central for those continuing further into the CBD or elsewhere). That’s not to say it wouldn’t be of any benefit, and if this can be achieved as a cheap bolt on addition to the network then it should be seriously considered.

The main problem with solutions like this are that is assumes a CBD centric view of transport in Sydney, and that the only congestion problem is in the AM and PM peaks during the week. It should be remembered that only 13% of workers commute to the CBD each day, and 77% of those do so by public or active transport. Most car traffic is not destined for the CBD, and most non-CBD travelers get to their destination by car. Improving CBD transport links is unlikely to entice such people away from their cars.

Another example is when the video shows footage of Parramatta Road at 11:30AM on a weekday, pointing out that there is little to no congestion and arguing that Parramatta Road is only congested during peak hour. Yet had that footage been taken on a Saturday, it would have shown congestion on par with weekday peak hour traffic. The reason for this is only partly the lack of weekend public transport. It’s also the dispersed nature of weekend journeys (where many people are visiting friends, going shopping, or heading to a sporting event) when compared to weekday ones (where many people are going to work or study in the CBD or a major centre). Cars are much better at transporting people for the former, while public transport is much better for transporting people for the latter.

It should also be remembered that a road project like WestConnex can recover a large proportion of its capital and operating costs from user tolls, and can thus be built and operated with only a small tax payer contribution. Meanwhile, public transport projects recover none of their capital costs, and only around a quarter of their operating costs from user fares, and thus require a much larger proportion of their cost to be government contribution. Nor do the costings for light rail used in the video appear to be in line with recent light rail projects. For example, the proposed Parramatta Road light rail project is about 15km in length (using a conservative estimate) and costs $975m, or $65m/km. Meanwhile, the CBD and South East light rail project about to commence construction is 12km in length and costs $1.6bn, or $133m/km. So the $2.2bn total cost could actually be double that, around $4.4bn. Compare this to the current proposed state government contribution to WestConnex of $1.8bn (which was itself obtained by selling an asset whose value increased on the assumption that WestConnex would be completed), and it soon becomes clear why the government bean counters prefer road projects to public transport ones.

Artists impression of Parramatta Road light rail. Click to enlarge. (Source: EcoTransit)

Artists impression of Parramatta Road light rail. Click to enlarge. (Source: EcoTransit)

Finally, neither the “Pippita Express”, nor the light rail network, would provide capacity for road freight transport. Even more so than passenger movements, freight movements are highly dispersed and therefore not suited to rail transport (unless it is from one city to another). Therefore, most freight transport happens on road within Sydney. There would be some benefit from fewer cars on the road, but it would likely only be beneficial around the edges.

This is not to say that the proposals put forward are bad. In fact, the “Pippita Express” is quite innovative and, as mentioned, should be investigated further. So should the extensions to the light rail network proposed in this video. Public transport improvements like these are far more efficient than roads at transporting people to the CBD and other major centres. And if this does help to create an integrated network of heavy rail, light rail, and buses that allow a greater level of mobility between other parts of Sydney, then it might begin to compete with cars in transporting people around for those previously described dispersed journeys. But until then, and for other reasons mentioned, the proposed rail projects are likely to be supplementary to, rather than in replacement of, WestConnex.

Video: WestConnex: Greiner’s folly, Part 2: South-west: the problem & the solutions, EcoTransit

This post was inspired by the recent EcoTransit video posted above. In it, the claim is made that 90% of trips into the CBD from the South West are by public transport, while 90% of trips to South Sydney and the UNSW/Prince of Wales Hospital area are by car. No source was provided for these figures, although a 2008 government report entitled Employment and Commuting in Sydney’s Centres, 1996 – 2006 does provide data for Sydney as a whole and is the basis of this post.

Notes: Car journeys include both drivers and passengers. The majority of the balance of journeys were made by public transport, with walking and cycling generally not exceeding 5%-10%. All figures refer to journeys to work only and come from 2006 census data.

The data splits Sydney up into:

  • 33 major “centres” (714,496 jobs or 37.1% of Sydney’s total)
  • “no fixed address” (78,077 jobs or 4.1% of Sydney’s total)
  • “unknown” (110,342 jobs or 5.7% of Sydney’s total)
  • “remainder” (1,020,985 jobs or 53.1% of Sydney’s total)

As a general rule of thumb, the centres tend to have both a higher employment density plus a lower share of journeys to work made by car, and these two are negatively correlated (i.e. if one is higher, the other tends to be lower). At the top of the list is the Sydney CBD, with an employment density of 546.4 jobs/Ha and share of journeys by car of 19.5%. This compares to the figures for the non-centre areas of Sydney (“remainder”), with an employment density of 0.8 jobs/Ha and share of journeys by car of 85.2%.

2013-06-18 Job density vs journeys to work by car - table

Click to enlarge. (Source: Employment and Commuting in Sydney’s Centres, 1996 – 2006, Bureau of Transport Statistics, pages 2, 10)

There are some shortcomings of these data:

  • They are relatively old (7 years). This means, for example, they pre-date the 2009 opening of the Epping to Chatswood Rail Link.
  • They only include journeys to work (as this is the question asked on the census). Journeys to schools, universities, TAFE, etc are not included, even though they tend to occur at similar times as the morning commute, nor are journeys for recreation, shopping, etc.
  • They don’t indicate what level of parking restrictions (for both on and off-street parking) have been put in place. Limiting the amount of available parking (particularly free and abundant parking) leads to a significant decrease in driving to work. The case of limited parking vs increased employment densities is a bit of a chicken and egg argument over which causes the other. It’s assumed here that they go hand in hand, and therefore employment density can be used as a proxy for parking limits.
  • They don’t show which specific mode of transport was used (e.g. driver vs passenger or train vs bus vs walk). These figures are available in the original source document, but have been aggregated for simplicity.

Looking at the data in a more visual form, patterns become quickly evident. Here the mode share of trips by car is shown on the y-axis, the employment density is on the x-axis, and the size of each bubble indicates the size of each centre by employment. Bubbles are colour coded by centre type the same way as in the table above.

2013-06-18 Job density vs journeys to work by car - graph

Click to enlarge. (Source: Employment and Commuting in Sydney’s Centres, 1996 – 2006, Bureau of Transport Statistics, pages 2, 10)

The link between employment density and driving to work is quite clear – the higher the employment density, the less likely workers are to drive to work. The correlation is strongest up to an employment density of around 150. Above this, higher employment densities do not seen to result in lower car usage, with the Sydney CBD (the large blue bubble on the far right), being a bit of an outlier. However, that is based on a fairly small sample size of 4 centres, whereas there are 29 centres under the 150 jobs/Ha threshold.

Proximity to the Sydney CBD also seems to result in lower car mode shares, evident by the non-CBD Sydney Central centres and the City Education/Health Precinct (the 3 blue and one green bubble on the bottom left) all having a lower car mode share than other centres with similar employment densities. Removing these 4 centres gives a much cleaner correlation, where going above the 150 jobs/Ha threshold still reduces car mode share, but at a lower rate.

Education precincts also have lower car mode shares. The City and Randwick Education/Health Precincts (the two green bubbles in the bottom left) both have lower car mode shares than other centres with similar employment densities. This is more pronounced for the former, given its proximity to the CBD, but can still be clearly seen for the latter.

Business parks, on the other hand, tend to have higher car mode shares. Norwest Business Park and Macquarie Park (the 2 red bubbles at the top), both have much higher car mode shares than other centres with similar employment densities. Olympic Park and Rhodes also have higher car mode shares than similar centres. This may suggest that it is their lack of good rail connections that encourage their workers to drive. The former 2 had no rail connections in 2006, while the latter 2 had only limited rail connections.

But support for this in the data is mixed, given that North Sydney and Chatswood (the two red bubbles on the right) both enjoy excellent rail connections, but still display a greater tendency for its workers to drive. In the case of North Sydney (the red bubble on the right), it has a much higher employment density than Surry Hills/Kings Cross (the lowest blue bubble on the left) does (369 jobs/Ha and 137 jobs/Ha respectively). Yet both have similar car mode shares (39.4% and 37.9% respectively) and are both in close proximity to the CBD. In addition, the Randwick Education/Health Precinct (the green bubble second from the bottom) has no rail connection and achieves a similar car mode share to St Leonards/Crows Nest (the red bubble third from the right) which does have a rail connection. This is despite the former having a lower employment density to the latter (70 jobs/Ha and 107 jobs/Ha respectively).

This suggests that the type of public transport available does not impact its mode share significantly. Instead, it’s the quality of that transport, things like speed and frequency, that determine its use. So somewhere like Rhodes, which has relatively infrequent and slow trains on the Northern Line, is not as well services as the Randwick Education/Health Precinct, with its frequent express buses that come in from Central and the CBD via bus only lanes.

Summary

Higher employment densities are correlated with lower car use in journeys to work, particularly for densities up to 150 jobs/Ha. Proximity of employment to the CBD enhances this correlation. Meanwhile, workers at universities are less likely to drive, while workers at business parks are more likely to drive. The availability of frequent and fast public transport encourages a modal shift to public transport, the mere existence of a rail connection does not.

Further Reading

Paul Mees’ 2010 book Transport for Suburbia discusses the issue of population density and whether a high population density is required to achieve high public transport usage. He argues that it is not, and that a low density city can still achieve high public transport usage.

Post Script: Paul Mees sadly passed away earlier this week on Wednesday, before this post was published, but after the above paragraph was written. He was a public transport advocate, heading the Melbourne based Public Transport Users Association for a decade, as well as an academic at both Melbourne University and RMIT.

Chris Loader at Charting Transport looked into this further for cities from various countries, then in more detail on Australian cities, and finally into great detail on just Sydney. Two maps looking at employment density and public transport use in Sydney most relevant to this from the final link are included below.

An earlier post on the WestConnex looked at whether it should link up to the CBD, and what sort of trips car travel is best suited to compared to what sort of trips public transport is best suited to.

Jobs density in Sydney. Click to enlarge. (Source: Charting Transport)

Public transport mode share by destination. Click to enlarge. (Source: Charting Transport)

The 2011 census data on journey’s to work (JTW) is set to be released this coming Wednesday, and it will be interesting to see if there have been any changes since the 2006 data. To prepare for this, here are some links to a few recent blog posts by Chris Loader at Charting Transport and Alan Davies at The Urbanist on the topic of mode share and urban density.

Is Los Angeles really the densest city in the US? – The Urbanist (17 Oct 2012)

This post points out that if you look at average densities alone, then Los Angeles is actually more dense than New York. However, this is due to New York having an incredibly dense core surrounded by urban sprawl at very low densities. A better measure is the population weighted density, which measures density based on the population density for people, rather than for parcels of land.

Population density for New York and Los Angeles based on distance from City Hall. Click on image for higher resolution. (Source: The Urbanist)

Comparing the residential densities of Australian cities (2011) – Charting Transport (19 Oct 2012)

Taking a more Australian centric look at population density shows that Sydney has the highest density of all Australian cities. In fact, Sydney’s median density of 33 people per hectare is closely followed only by Melbourne at 28, with no other city being above 22. It argues that if suburbs are defined are areas with a population density of 30 people per hectare, then Sydney’s average density doesn’t drop below 30 until you are 39km from the CBD, compared to 9km for Melbourne.

Population density for Australian cities. Click on image for higher resolution. (Source: Charting Transport)

Does public transport use correlate with density in Australian cities? – The Urbanist (21 Oct 2012)

The question then arises about whether there is a link between population density and public transport use. Alan Davies finds that weighted population density and public transport use have an R squared of 0.943 when a logarithmic curve is fitted along the graph below, which indicates a very strong correlation. However, he points out that high public transport use is more likely to be caused by dense employment centres (which is covered more in the subsequent Charting Transport blog post).

Public transport mode share vs population density for various Australian cities. Click on image for higher resolution. (Source: Charting Transport via The Urbanist.)

How did Sydney get to work in 2006? – Charting Transport (26 Oct 2012)

Something that sets Sydney apart from other cities is a large number of dense employment centres, whereas other Australian cities tend to just have their CBD. And public transport usage is higher for Sydney both in CBD travel and travel to non-CBD employment centres in other cities (e.g. the proportion of workers in Bondi Junction, North Sydney, Parramatta, Chatswood, and St Leonards who travel by public transport ranged from 34% to 53%, whereas no centre in any other Australian city was above 15%). However, this is also due to state and local governments in Sydney restricting the amount of parking available for workers, meaning many of them have no choice but to take public transport.

Employment density in Sydney. Click on image for higher resolution. (Source: Charting Transport.)

CORRECTION: In the post Transport Master Plan (part 2): What’s missing? published on Friday 7 September, it was claimed that planning for reservations for future transport projects in the Transport Master Plan had only been done for road projects, and not for public transport projects. This was incorrect, and information on public transport corridor reservations was included further into the report. The error was due to the large size of the report (370 pages) and limited time available to read through it in detail and has now been corrected.

Context

Before looking into what the Transport Master Plan has to say on roads, it’s worth giving some perspective on private cars vs public transport.

Roads, and the private motor vehicles that run on them, provide two major benefits over public transport. First, they are significantly more flexible in terms of timing and journey start and end points. Second, the majority of the cost is borne by the user (some costs, such as noise and air pollution, or the free use of roads, are communal costs, but these are actually quite small), whereas public transport is heavily subsidised (in Sydney the user pays 20% to 50% of the total operational costs, and none of the capital costs, of public transport).

The biggest benefit of public transport over private road transport is in capacity. Assuming cars travel spaced 2 seconds apart, you can fit 1,800 vehicles per hour per lane. Ignoring effects of delays from red lights and cars with multiple passengers, that’s 1,800 passengers per hour. A Waratah train has a seated capacity of 896 passengers, and the current maximum capacity on the Cityrail network is 20 trains per hour (which the Harbour Bridge and Eastern Suburbs Lines both get very close to during peak hour), giving you just under 18,000 passengers per hour. In other words, rail has a capacity 10 times the size of cars. To put this into context, the Sydney Harbour Bridge has 10 lanes: 2 for rail, 7 for cars and one bus lane. If you were to convert all of these 10 lanes to private vehicle traffic, then it would have the same capacity as a single track for rail.

This is not to say that there is no place for new roads in Sydney, in fact when a new road is financed and built privately, then funded via tolls in a user pays manner over an agreed period of years then the government should be building as many new roads as it can. But if the government has to fund the new road, then the question needs to be asked “will this cost one tenth of the cost of a rail line”? There was a great post about this at A State Of Mind, which talks more about this sort of concept.

The Transport Master Plan

Road projects announced in the Master Plan include the current M2 and M5 widenings, an M4 East, an M5 East duplication, an Inner West Bypass (linking the M4 East with the M5 East), an F3-M2 link, an extension of the F6 through to the CBD, a link between Port Botany and the Airport, widening of the M7 North of the M4, widening of the M4 East of Parramatta, the Castlereagh Freeway (between the M7 and Richmond) and an outer orbital going North-South along outer Western Sydney. By anyone’s reckoning, that is a big wishlist!

Road projects recommended by the Master Plan. Click on image for higher resolution. (Source: Transport Master Plan, page 140.)

What we don’t know yet is the priority and the specific order in which they will be built. The M2 and M5 widenings, currently being finished up or having just started, are obviously the first cabs off the rank. And based on the 6 corridors which are expected to face the most congestion, the other projects with high priority appear to be the M4 East, the M5 East duplication, the Inner West Bypass, and the M4 widening. This should all be clarified by Infrastructure NSW when their 20 year report is released to the public next month.

However, merely building more roads is not the solution. New roads cause induced demand – more people get into their cars until eventually roads are saturated and congestion returns. Doing this will not eliminate congestion, it will only move the congestion closer to the ultimate destination (i.e. the Sydney CBD), and cost tens of billions of dollars in the process. To quote the Herald, “$10 billion is an awful lot to pay for a bigger traffic jam”.

To avoid this problem, cities like London, Copenhagen and Singapore have introduced congestion charging in their CBDs to discourage people from driving all the way into the city. And while the current government has refused to introduce congestion charging (having promised last election not to do so), they are considering 3 potential reforms that could have a similar effect:

  1. Distance based tolling – This is currently in place on the M7, where you pay based on the distance travelled, and is capped at $7 per trip.
  2. Time based tolling – This is currently in place on the Harbour Bridge/Tunnel, where you pay a lower toll during off peak hours in order to encourage a more even spread of car travel throughout the day.
  3. An increased parking levy – This is an existing charge on each parking space in the CBD, charged to the owner of the property that owns the space, and may be increased.

In all three cases, commuters would be discouraged from driving into and parking in the CBD during peak hour. Those who do would pay extra but receive a better travel experience with less traffic and more abundant parking, while the funds raised would go towards funding transport infrastructure. The report recommends using tolls to both fund new infrastructure and manage congestion, while reforming the tolling system to give Sydney a city-wide consistency (page 329).

If the government actually does implement these policies in order to fund the new roads that are financed, built and operated by the private sector, then they might actually achieve the goal of alleviating congestion without significant cost to the taxpayer. And if that is the case, then these are definitely roads that the state should build.

There are many things missing from the Draft Transport Master Plan. While defining it by what it doesn’t have, rather than what it does, would result in a never ending list, there are some major omissions that deserve some specific mention. They are, in no particular order:

Integrated fares

While integrated ticketing is being introduced with the rollout of Opal, allowing commuters to use just one ticket to get around Sydney, there is nothing in the transport plan suggesting that they will be charged an equal fare regardless of which (or how many) mode (or modes) of transport they use to reach their destination. In other words, if you are going from point A to point B, then it shouldn’t matter which way you get there, you should be charged the same fare.

At the moment Sydney does not have integrated fares. In fact, if you use 2 vehicles (unless it’s trains or you have a weekly MyZone ticket) then you are charged a premium fare despite the fact that having to make a transfer is a reduction in the quality of your journey. This has led to many anywhere to anywhere bus routes all over Sydney, as commuters refuse to pay extra to change from one bus to another, resulting in the available buses being spread thin and leading to low service frequencies.

Sydney currently has a radial bus network, as seen on the left. Proposed changes to a radial and circumferential network that emphasises transfers, as seen on the right, would improve connectivity but also require integrated fares. Click on image for higher resolution. (Source: Transport Master Plan, page 55.)

The transport plan seeks to change this model, moving to a grid (or cobweb) style network that requires transfers, but provides both frequency and connectivity. However, to work effectively, integrated fares are required to ensure that commuters are no worse off for having to transfer. This currently does not appear to be in the plan.

The Parramatta to Epping Rail Link
The O’Farrell government went to the 2011 election promising to prioritise the Northwest Rail Link (NWRL) ahead of the Parramatta to Epping Rail Link (PERL). Initially, this meant deferring the PERL until 2036, with a NWRL completed in 2019 and a Second Harbour Crossing completed some time in between. But when the Sydney’s Rail Futures plan was completed in the middle of this year it was missing any mention of the PERL, the first indication that this project had been dropped altogether.

Forward planning (unless it’s roads)

The Master Plan lists 3 new freeways that it would like built (an M4 East, an M5 East duplication, and an F3 to M2 link) plus another 3 new freeways for consideration beyond the 20 year scope of the plan (an F6 linking Waterfall to the airport, an Inner West Bypass between the M4 East and M5 East, and a freeway linking the M4 East to the M2). It then also recommends that the government begin planning reserving land in outer suburban areas so that freeways can be built there many decades into the future. This is fantastic forward planning, and should be commended as it will avoid huge tunneling costs in the future that we are contemplating today.

The transport plan has recommended reserving corridors for future roads, but does not include a similar recommendation for reserving corridors for future rail lines. Click on image for higher resolution. (Source: Transport Master Plan, page 140.)

And yet when it comes to public transport, no such recommendations are made. Where is the action on reserving land for future rail lines, light rail corridors, bus rapid transit, etc? This included in the 20 year rail plan, so why is it missing from the transport plan? Why has it been removed?

It’s hard to imagine a transport plan since the height of the automobiles golden age back in the 1950s that has felt so biased towards roads and away from public transport. Previous plans have ended up seeing more roads built than public transport, but at least they made an effort at planning for public transport before abandoning those plans. This one just skips that step entirely!

UPDATE (9 September 2012): Some further reading reveals that planning has been included for reserving corridors for both roads and public transport. The following diagram illustrates the locations of the corridors. The report, at 370 pages, was quite long and limited time meant I was unable to go through it in as much detail in the days following its release and I unfortunately missed this.

Transport corridors, both road and public transport, that are being investigated or reserved for future transport infrastructure projects. Click on image for higher resolution. (Source: Transport Master Plan, page 197.)

Funding and costings

There are some details on this, but it tends to be broad statements with some token details around the edges. For example, costings for individual projects are not included, although a figure of $100 billion over the next 20 years has been mentioned in the media. If this is accurate, then it is actually within the scope of the existing transport capital expenditure budget, which is equal to $25 billion over the next 4 years (Transport Master Plan, page 323), or roughly $125 billion over the next 20 years with some simple estimation.

The report has some interesting ideas. These include: increasing parking levies inside activity centres to discourage car use while funding public transport, reforming car registration to take into account road use (code for km based fees, rather than a flat fee regardless of how much you use the road), reforming public transport agencies (e.g. the creation of Transport for NSW, franchising Sydney Ferries, and splitting Railcorp into Sydney Trains and NSW Trains), allowing more commercial sites into existing transport interchanges, and capturing value created from transport investment. The last one is probably the one with the greatest scope to raise additional revenues, and one that I have written about previously.

However, other than these few points (not many for a plan this big), details on funding and costing remain general in nature and are lacking in specific details, examples or case studies much beyond saying “we will investigate this further”.

Light rail to Sydney University or to Barangaroo

Although the government has not decided what it will do with the results of the Light Rail Feasibility Study yet, the study has been completed, and this is evident by inclusion of details of light rail in the Master Plan. It suggests light rail for George Street in the CBD and a line on or under Devonshire St that then goes along Anzac Parade to UNSW. But gone is any mention of light rail to the University of Sydney or, more importantly, to Barangaroo. It is true that Barangaroo will have a new walkway to connect it quickly with Wynyard Station, and that it will sport a new ferry wharf. But it will be intriguing to see why the decision has been made to not extend the light rail line through to Barangaroo via The Rocks.

Bus priority

This has been talked about ever since the Unsworth Review into buses back in 2004. With most buses now equiped with GPS tracking teachnology, it is possible to work out when a aprticular bus is running late. In order to get that bus back on time, priority can be given to it at traffic lights, giving that bus a green light earlier than would normally happen. To ensure buses don’t run earlier than the timetable, this would only happen when a bus is late. This would be a huge improvement in reliability for Sydney’s bus network, and it’s unfortunate to see that little progress has been made in the last decade on implementing this.

Congestion charging

This has been ruled out by the government, despite such measures having worked well in places like London or Singapore. The idea behind it is that by charging road users a premium to use CBD roads during peak hours it will encourage some car users to travel at other times or to take public transport, thus giving those who do pay a faster trip with less traffic. It would also help to fund public transport. Instead, we have a situation where it is free to use surface streets which causes noise and pollution as well as danger for pedestrians (remember that 93% of CBD trips are on foot). Meanwhile, if you want to use the Eastern Distributor or Cross City Tunnel, you are charged. It really should be the other way around.

However, the government is looking at raising the parking levy, a tax on parking spaces in the city (I think it only applies to off-street parking). This would be a bit like a congestion charge, but would only discourage trips by people travelling into the CBD, while doing nothing to discourage trips through the CBD. And it is the latter that should be discouraged the most, as it congestion caused by people who aren’t even going into the CBD.

A second Sydney airport

The Premier Barry O’Farrell has made a strong stand on this. He doesn’t want a second airport in Sydney, and is not planning for one. This is a bit like when the Wran Government sold off land intended for the M4 East in an attempt to prevent the construction of that freeway. And while this seems to have delayed its construction, now we find ourselves with a government looking to pay $10-$15 billion to build that freeway in an underground tunnel instead, which has the effect of sucking funds away from public transport projects. Similarly, not planning for a second airport will not remove the need for one, it will only increase the problems and costs of one when it is eventually built.

Project priority and a timetable for completion

Some idea of priority is given in terms of whether a project is short term (0-5 years), medium term (5-10 years) or long term (10-20 years) in nature. But this is quite vague, and only applies to some projects. Road projects in particular, have no sense of priority at all, and await Infrastructure NSW’s report before some idea of which order they will be built in will happen.

Some of the smaller transport stories from the last 2 months. In chronological order:

Moorebank intermodal freight terminal (23 April)

The Federal government is to build a $1.6bn freight terminal in Moorbank in Sydney’s Southwest. The site will connect to a freight rail line with a direct link to the Port Botany, Chullora and Enfield industrial areas as well as the Southern Sydney Freight and Northern Sydney Freight Lines currently being constructed. The end result will be an estimated 3,300 truck trips taken off roads and onto rail each day.

Moorebank Intermodal

The proposed Moorebank Intermodal freight terminal will be located in Southwest Sydney, with rail access to take trucks off the road. (Source: Department of Infrastructure and Transport)

The decision to go ahead with this project has been criticised by Qube Logistics, a group headed up by Chris Corrigan, which wanted to build and operate such a site itself. The advantage of Qube’s proposed terminal would be that it could be built at no cost to the taxpayer. However, the government site is both larger and closer to the freight rail line and it would also avoid the problem of a player in the logistics industry (Qube Logistics) owning a key piece of infrastructure and thereby being able to deny access to its competitors.

Crowding on trains is increasing (3 May)

Morning peak hour trains have an average of 1.23 passengers per available seat, an increase on 1.19 in the last year. According to the Cityrail report, the most crowded trains are on the Bankstown Line and the Western Line carries the most passengers, with only trains from the Eastern Suburbs and Blue Mountains having spare seats on average.

Train patronage March 2012

Train patronage March 2012. (Source: Cityrail)

Sydney Ferries will be privately operated starting July (3 May)

Veolia Transdev and Transfield Services will take over operation of Sydney Ferries as soon as next month. Ownership and planning of ferries, as well as the setting and collection of fares, will remain with the government and the Sydney Ferries brand will remain unchanged. Making ferries operate under a franchising model will bring them into line with the system used for the private bus network aswell as the light rail line, both of which are (mostly) publicly owned but privately operated. If this change results in a reduction in the cost to the government of operating the ferry network then expect speculation on whether the government will look to expand franchising to Sydney Buses and the rail network (particularly CountryLink).

Railcorp to be split into 2 entities (15 May)

Railcorp will be split into Sydney Trains (which will run the suburban part of the Cityrail network) and NSW trains (which will run the intercity part of the Cityrail network and the entirety of the CountryLink network). As part of this, 750 back office staff will be offered voluntary redundancies in order to cut costs and responsibility for cleaning will be put into a new subsidiary unit in order to improve cleanliness on trains and at stations. Nationals backbencher Andrew Gee denies that this is a step towards privatising CountryLink/NSW Trains. However, this would not appear to extend to a franchising of NSW Trains, as is being done with Sydney Ferries, particularly if the ferries plan is a success financially.

Quiet carriages made permanent (23 May)

After a trial of so called quiet carriages, they are to be made a permanent feature of Newcastle and Central Coast trains. A trial will now be done on the Blue Mountains and South Coast Lines.

1,200 new park and ride spots (29 May)

An additional 1,200 car parking spaces will be built at stations in order to encourage train use, as well as improvements to transport interchanges such as lifts, kiss and rise zones, and bus interchanges. Big winners are Sutherland (300 spaces), Oak Flats (230 spaces), Lindfield (240 spaces), and Gordon (160 spaces).

I sometimes wonder if park and ride is the most cost effective way of improving train patronage. For example, each new parking spot in Oak Flats costs $25,000, and is quite reasonable. But the cost for the other 3 stations ranges from $123,000 to $275,000 per parking space. (These amounts are inflated as they include the cost of other improvements, but are a good rough guide.) Above a certain price it surely must make sense to re-direct that money towards funding feeder buses rather than parking spaces.

A series called Moving Beyond the Automobile has done a piece on car parking in New York called parking reform. It outlines how cheap (often free) and plentiful on street parking in effect provides a subsidy to car drivers and questions whether there is a better use for the public space currently given away to cars for free. (Props to Reinventing Parking for posting it.)

Ideally, parking would happen off street in parking garages that charge a market rate, with some limited short term on-street parking for car drivers who need to make quick trips. Otherwise, it is normally ridiculious to use such a limited resource (street space) for the indefinite storage of automobiles.

It is looking more and more likely that Sydney’s troubled monorail will be removed from CBD. Sydney City Council has wanted the monorail removed to make way for light rail, with Lord Mayor Clover Moore having opposed the monorail ever since it was first built back in the late 80s when she was the local state MP (see video below). Now it appears that the state government is also shifting to a position to tear down the monorail, having told the redevelopers of the Entertainment Centre (through which the monorail passes through) “don’t let the monorail constrain your thinking”.

The history of the monorail dates back to the 80s, when redevelopment of Darling Harbour (along with neighbouring Pyrmont and Ultimo) was a major urban renewal project designed to co-incide with bicentenary celebrations planned for 1988. Part of this urban renewal included plans for a new transport link into the area. The choice came down to light rail or a monorail. The decision to ultimately go with the monorail appears to have been a political one, motivated by the minister responsible Laurie Brereton, who took responsibility for the project out of the committee and into his own hands. A detailed SMH article explaining the behind the scenes events that led up to this was published in 1988 notes that the light rail option was described as the “best long-term solution” but that the monorail was chosen because Mr Brereton personally supported it, as did Premier Neville Wran.

Pitt Street

Pitt Street is currently a one way street with 2 traffic lanes and 2 parking lanes (one on each side). The monorail pylons prevent the lane on the left from being turned back into a traffic lane. Click on image for higher resolution. (Source: Google Maps)

A light rail line would eventually be built in 1997 between Central and Lilyfield which is now being extended through to Dulwich Hill. The current O’Farrell state government has also pledged to extend this further through the CBD (most likely down George Street), to Sydney University and to UNSW. However, putting the light rail on George Street would mean re-diverting some traffic down other streets (potentially removing all private vehicle traffic altogether from portions of George Street) and one option is to make Pitt Street a two way street again by removing the monorail’s pylons from the ground and thus allowing a constant flow of traffic along what is now a parking lane only (see image).

I had previously supported the idea of keeping the monorail, it’s already been built and runs at no expense to tax payers. But if removing it in order to replace it with a more effective and more efficient light rail system would improve transport options, then I think it’s a good move.

The NSW government yesterday announced the final route for the Northwest Rail Link (NWRL). This follows many months of community consultation, feedback and design changes. (For part one, go here.)

NWRL

Alignment of the Northwest Rail Link and location of stations. Click on image for higher resolution. (Source: Transport for NSW.)

Key changes include:

An additional two stations. This was hinted at earlier this year. The two stations will be at Cudgegong Road and Kellyville. The Kellyville Station is actually the previously proposed Samantha Riley Drive Station, with the previously touted Kellyville Station moved further South and renamed Bella Vista. The Bella Vista Station is on the Western end of Norwest Business Park, doubling the number of stations at Norwest. Two stations at Norwest was also hinted at earlier this year, and I spoke in its favour. Despite some calls for it, the line will not be extended through Schofields and into Marsden Park, at least not yet.

A “skytrain” (viaduct). The line between Bella Vista and Rouse Hill will be on a 4km long elevated viaduct, which has been dubbed a skytrain by Transport Minister Gladys Berejiklian. This was previously to be party in an open air cutting underground and partly in a viaduct above ground. Either opens would allow roads to cross the rail line without the need for level crossings. The viaduct option was cheaper, but has seen some criticism for being more of an eyesore than a cutting.

1,000 extra parking spaces, bringing the total number of park and ride spaces to 4,000.

To give you some context, there are 47,000 residents within a 1km catchment area of the 8 new stations and the government expects this to take 160 city bound M2 buses off the road, a 67% reduction or 2.5km if they were lined up on the road. 29 million people are predicted to use the NWRL per year within 5 years of its opening. The Northwest Growth Centre, which the NWRL partly travels through, is expected to see 200,000 additional residents in the next 30 years.

The cost has increased from $7 billion up to between $7.5 billion and $8.5 billion. This appears to be due to the addition of 2 stations, one of which will require the demolition of a shopping centre, and 1,000 parking spaces. Construction is expected to begin in 2014 and take 5 to 6 years, suggesting a completion date of 2019 or 2020.

Interestingly, the NSW government’s submission to Infrastructure Australia for the NWRL included only the original 6 stations and not Cudgegong or Bella Vista, nor the revised Kellyville Station. Don’t be surprised if the federal government rejects the submission on a technicality as it differs from the final version, just as they ruled out providing funding for the NWRL earlier because no submission had been lodged.

The government has not ruled out a privately built and run line, so long as there are no additional ticket costs like at the airport stations, that the line be integrated with the Cityrail network and be run with double deck trains.

How Car Share works

Posted: September 5, 2011 in Transport
Tags: ,

Despite having a car, I take public transport or walk for most of my journeys, using my car perhaps once or twice a week. Even then, about half of those trips could just as easily be made on public transport. I also have my car just in case I need convenient access to a vehicle for when I need to get to somewhere out of the way or at a strange hour when public transport is thin.

The problem is that my car costs me about $3,000 in fixed costs each year (rego, insurance, roadside assistance, maintenance, depreciation, finance, etc) before I even turn the ignition key. At $250 per month, that’s a big price to pay “just in case”. And this is before petrol!

GoGet Cars in Randwick

The circle represents the area within a 10 minute walk and contains 7 cars. (Source: GoGet)

People in this situation have been turning to car share schemes as a solution. Sydney has GoGet and Melbourne has Flexicar, with Green Share Car as the third player. They have cars parked around the CBD and inner city which you hire by the hour, then return to where you got them. You can book one ahead of time, or you can just walk up and hire one that’s sitting there. Around my area in Randwick, there are 7 parked within a 10 minute walk of where I live. In busy areas, there are parking bays reserved specifically for shared cars, meaning you always know where it will be because they get priority.

Cost is around $5-$10 per hour, with petrol included. There are also sometimes additional costs per kilometre (30c to 35c) and a monthly subscription fee ($10-$30). For the occasional car user, like myself, this ends up being much cheaper than owning a car outright that sits there unused for 95% of the time.

By allowing multiple people to effectively just own and share the same vehicle, valuable on-street or garaged parking is conserved. The City of Sydney has now mandated that any new residential apartment buildings contain a certain number of parking spaces for share cars within the building’s parking lot. The City of Sydney estimates that it has kept 800 cars off the streets, either because people have deferred a car purchase or sold their existing car.

It’s also useful for a family that has a car and wants to buy a second car (one for mum and one for dad), when really all they need is occasional access to a second car.

Liliana the GoGet car

GoGet cars are identifiable by the orange driver’s side rear view mirror. Each has a name, to make them easily identified, this one is called “Liliana”. (Source: author)

However, these car share schemes aren’t charities, they are for profit companies. And this has led to some controversy recently as they tend to receive free reserved parking bays from local councils in which to park their cars. In Sydney’s Eastern Suburbs, a Waverly Council counsellor has called for GoGet to be charged for these spaces, arguing that the company should not be profiting from the council. While I can empathise with this point of view, I would argue that the benefit of widespread car share schemes in reducing on-street parking and encouraging public transport instead of driving mean that the costs do outweigh the benefits for rate payers.

So what do you think? Should share cars get free parking spaces to maximise benefit to residents or is it just inflating the profits of private companies that would otherwise have paid?